
2023 by the numbers
- 0: The number of recessions in 2023, even though one was widely expected by most economists.
- 1: The number of rating agencies (out of three, Moody’s) that still has US debt rated as AAA.
- 22.2%: The return for the MSCI ACWI, representing global stocks, clearly a strong year.
- 26.3%: The gain of the S&P 500. This return was driven by the Magnificent Seven, which jumped 76.3%, with the remaining stocks gaining 13.7%.
- 5.25%-5.5%: The Fed’s policy rate reached in July as they worked to tame inflation, the highest level since 2001; the same level it was at year-end.
- 3.1%: The November 2023 headline CPI figure, having fallen from the 9% level it hit during the summer of 2022; still above the Fed’s 2% target.
- 4.98%: The level the US 10 Year Treasury closed at on 10/19/2023. The last time it ended that high was 7/19/2007, when it closed at 5.04%. 10 Year Treasuries rallied at the end of the year, closing at 3.88%.
Forecasters don’t have a working crystal ball
At the end of each year, it is common for economists and market strategists to make their predictions for the upcoming year. While we are confident that the people making these predictions are indeed intelligent people with good intentions, it doesn’t change the fact that their predictions are often very wrong. Specifically, over the last five years the forecasts have ranged from being 26% too low to 21% too high. On average, the median annual estimate was off by about 18%, nearly double the index’s long-term average annual return.
Exhibit 1
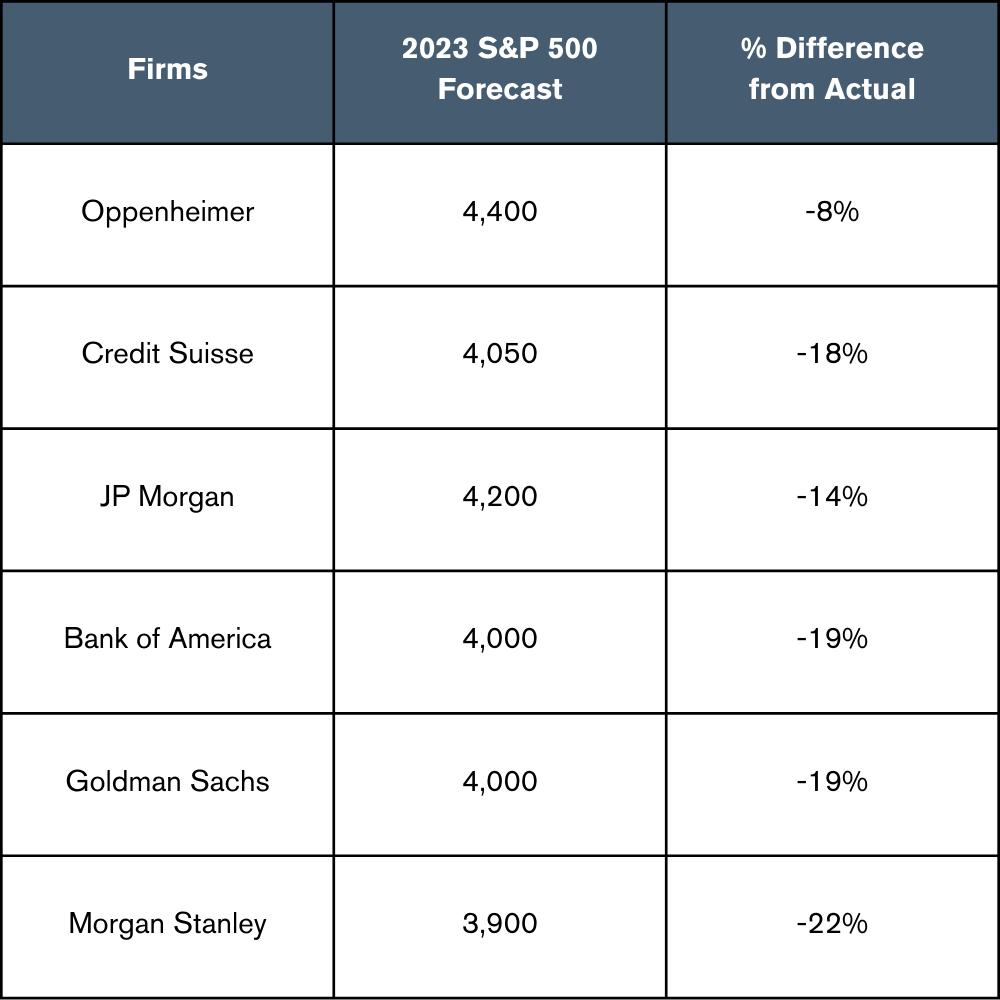
Source: https://www.marketwatch.com/story/wall-streets-stock-market-forecasts-for-2022-were-off-by-the-widest-margin-since-2008-will-next-year-be-any-different-11671583416 , Yahoo! Finance The S&P 500 ended the year at 4769.83.
Exhibit 1 looks at the same institutions we reviewed last year at this time, so this list had no cherry-picking. We wanted to update their 2023 forecasts with what occurred. Each of the firms shown had lower forecasts vs. what actually occurred, ranging from 8% to 22% lower. In other words, while forecasting makes for interesting debate and conversation, we wouldn’t suggest basing your investment strategy off it.
An update on US inflation and the Fed
Regarding inflation, for at least the last year we have spoken about the three P’s of pace, pause, and pivot. Going back to the 2nd quarter of 2023, we saw the Fed implement their last rate increase, moving rates up by 0.25% in July. Since then, the Fed has hit the pause button as the Fed Funds rate remains at the 5.25-5.5% range it set over the summer.
The Fed says they will continue to be data dependent on making any future changes as inflation is still higher than desired, and with a labor market that remains tight. They have continued to promote the idea that even though inflation has moderated from last year’s highs, there is still a long way to go to hit their 2% target, and that there are no guarantees what the future will bring. In other words, it could be a while before the Fed pivots, and starts lowering the Fed Funds rate.
U.S. Stocks
- All US stock indexes had strong gains for the quarter and the year.
- The majority of the S&P 500’s 2023 return came from just a few stocks, known as the Magnificent Seven.
Exhibit 2
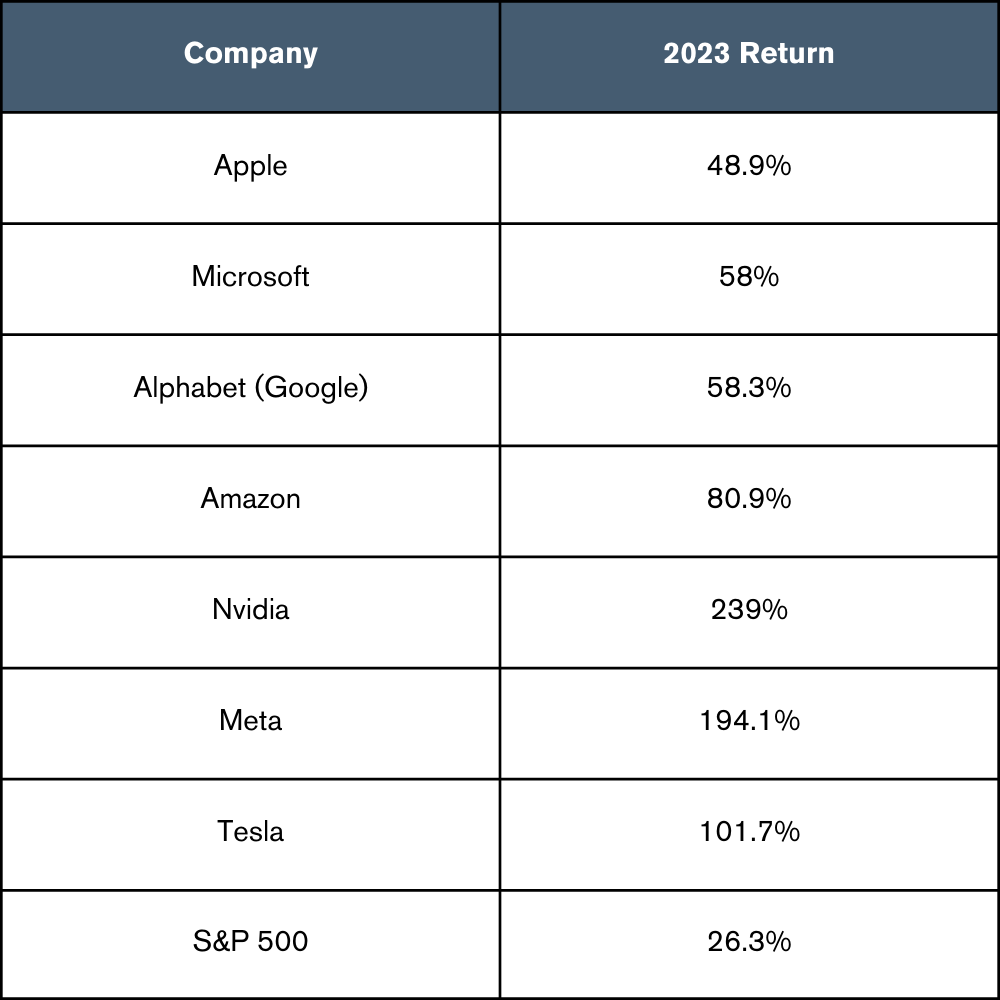
Source: Morningstar
The seven stocks shown in Exhibit 2, known as the Magnificent Seven, were the key drivers behind the overall success of the S&P 500 in 2023. These seven stocks had a combined 2023 return of 76.3%, compared to the 13.7% return for the remaining stocks of the S&P 500. This is important because when investors see the return of the S&P 500, they should know it is being driven by just a few names and not the broad market in general. Plus, when a stock rally is broad, the overall health of the market is considered to be better.
Exhibit 3
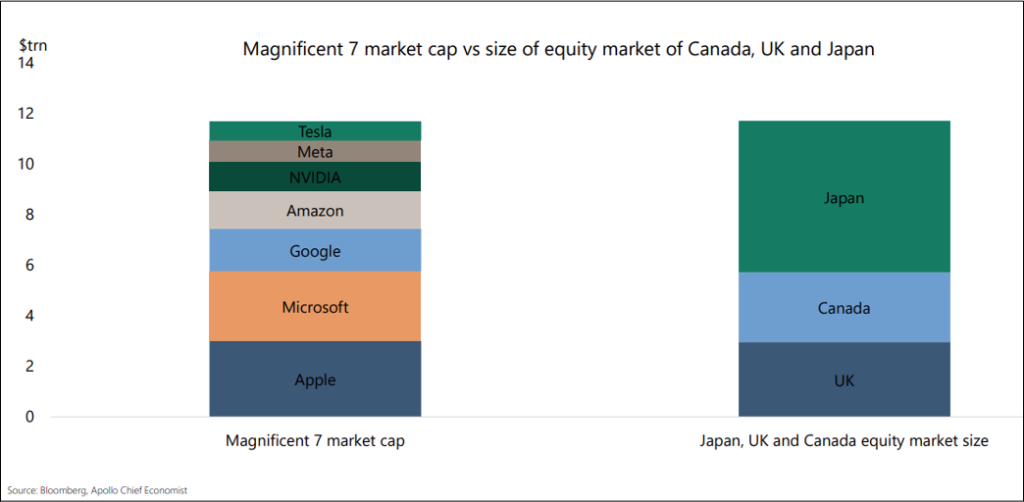
Just how big are the Magnificent Seven today? They are so large that their combined market cap is roughly the same size as the equity markets of Japan, Canada, and the UK combined (Exhibit 3). It is also important to think about the valuation of these seven US large cap stocks. Per JP Morgan, at year end these 7 stocks had a forward P/E ratio of 26.9x, vs. 19.5x for the S&P 500 overall and 17.1x for the remaining stocks in the S&P 500, suggesting these seven stocks are overvalued vs. their peers. It doesn’t mean they still can’t go up; it just means they appear to be overvalued.
Non-U.S. Equity
- Like US stocks, non-US stock returns were quite strong in Q4 and for the year.
- Unlike US stocks, the rally in international stock markets was broader.
- Non-US developed large cap stocks underperformed their US counterparts over the quarter, but non-US developed small cap stocks outperformed US small caps.
Unlike the S&P 500, whose return is dominated by just a few stocks, international indexes are currently more balanced and diversified. The top ten stocks in the MSCI World ex-US IMI returned 18.3% during 2023, while the remaining stocks generated a very similar return of 18.0%.
Exhibit 4
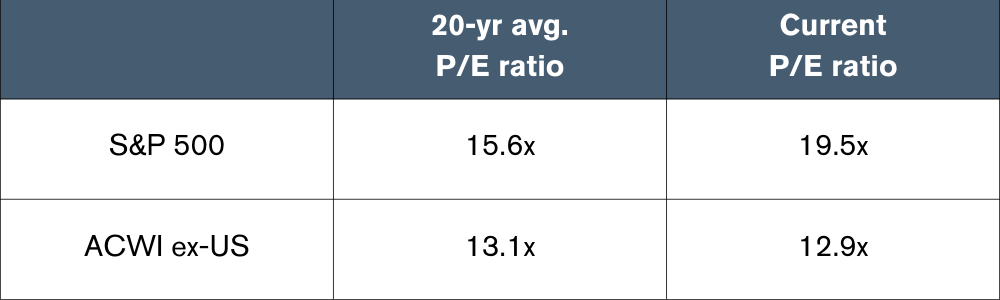
Source: Facstet, MSCI, S&P, JP Morgan Asset Management, Data as of 12/31/2023
A common question we receive is “why should we own non-US stocks when US stocks have outperformed non-US stocks for most of the last decade or so?” One reason why we like international stocks is for diversification. While US stocks have outperformed more recently, that hasn’t always been the case. In fact, you only need to go back to the 2000’s to find the last period when international stocks outperformed. Remember the “lost decade” when the S&P 500 earned almost no return? Plus, we also know the US Dollar is relatively strong vs. a basket of other major world currencies. If the USD were to weaken, it would be a tailwind for non-US stocks denominated in those currencies. Finally, as Exhibit 4 shows, not only are most non-US stocks currently undervalued vs. their last 20-year averages, they are also well undervalued relative to US stocks, which are currently overvalued vs. their own 20 year average.
Global REITs (Real Estate Investment Trusts)
- Global REITs, as represented by the Dow Jones Global Select REIT, jumped 9.8% over the quarter, driving the 11.7% return for 2023.
- In the US, the sectors that performed the best over the year were data centers (30.1%), and lodging/resorts (23.9%). Source: NAREIT
Global Fixed Income
- There was a significant decline in US bond yields during the 4th quarter that drove returns. In particular, the intermediate and long parts of the curve saw their yields fall more dramatically vs. the shorter end of the curve. As a reminder, prices and yields move in opposite directions, so a drop in yields actually means positive returns.
- Global bonds ex-US (hedged USD) had a strong 2023 with gains of 8.3%.
Bond yields experienced quite a ride in the 4th quarter. For example, the 10-Year US Treasury started the quarter at 4.59%, closed as high as 4.98% in mid-October, and then steadily fell to end the year at 3.88%.
There are several possible reasons that rates began falling including the Fed keeping rates steady as inflation steadily fell, along with a belief the Fed would start cutting rates in 2024.
Exhibit 5

Source: Bloomberg, data as of 12/31/2023
There are several good stories that can be told from looking at Exhibit 5. For one, you can see the rate levels we are at today vs. the very low levels of just a few short years ago (not shown, but trust us, they were much lower). This is important for investors as they can now receive actual income on their fixed income (bonds). Also, you can see how the curve for 12/31/2023 is below that of the one for 9/30/2023, highlighting how strong the bond rally was over the last quarter, generating strong returns across Treasuries and other US bond categories. Plus, while the curve from 12/31/2023 is very similar to the curve from the previous year, it doesn’t show how much change actually occurred throughout the year. And finally, the curve is still inverted, meaning shorter term yields are higher vs. longer term yields. Nonetheless, we would caution about having too much in cash and short-term bonds, as reinvestment risk could be an issue.
Overall, we continue to view our bond allocations as a method of reducing overall portfolio risk (as measured by standard deviation), given that stocks are expected to have much higher volatility. Our portfolio’s focus will continue to be on high quality bonds with an emphasis on short to intermediate duration government and corporate bonds, where default risk has historically been relatively low.
Investment advisory services offered through Equita Financial Network, Inc. (“Equita”). Equita also markets investment advisory services under the name AegleWealth LLC. East Bay Investment Solutions and Equita Financial Network, Inc. have an arrangement whereby East Bay Investment Solutions, a Registered Investment Advisory firm, provides model recommendations on a consulting basis to Equita Financial Network, Inc. Equita Financial Network, Inc. maintains full discretion and trading authority over its clients’ accounts.
This document contains general information, may be based on authorities that are subject to change, and is not a substitute for professional advice or services. This document does not constitute tax, consulting, business, financial, investment, legal or other professional advice, and you should consult a qualified professional advisor before taking any action based on the information herein. This document is intended for the exclusive use of clients or prospective clients of Equita Financial Network, Inc. Content is privileged and confidential. Information has been obtained by a variety of sources believed to be reliable though not independently verified. To the extent capital markets assumptions or projections are used, actual returns, volatilities and correlations will differ from assumptions. Historical and forecasted information does not include advisory fees, transaction fees, custody fees, taxes or any other expenses associated with investable products. Actual expenses will detract from performance. Past performance does not indicate future performance.
The sole purpose of this document is to inform, and it is not intended to be an offer or solicitation to purchase or sell any security, or investment or service. Investments mentioned in this document may not be suitable for investors. Before making any investment, each investor should carefully consider the risks associated with the investment and make a determination based on the investor’s own particular circumstances, that the investment is consistent with the investor’s investment objectives. Information in this document was prepared by East Bay Investment Solutions, and modified by Equita. Although information in this document has been obtained from sources believed to be reliable, East Bay Investment Solutions and Equita does not guarantee its accuracy, completeness or reliability and are not responsible or liable for any direct, indirect or consequential losses from its use. Any such information may be incomplete or condensed and is subject to change without notice.
Visit eastbayis.com or more information regarding East Bay Investment Solutions.
Investment Advisory services offered through Equita Financial Network, Inc., an Investment Adviser with the U.S. Securities and Exchange Commission. Equita Financial Network also markets investment advisory services under the name AegleWealth. The foregoing content reflects our opinions and is subject to change at any time without notice. Content provided herein is for informational purposes only and should not be used or construed as investment advice or a recommendation regarding the purchase or sale of any security. There is no guarantee that the statements, opinions, or forecasts provided herein will prove to be correct. All investing involves risk, including the potential for loss of principal. There is no guarantee that any investment plan or strategy will be successful. Along with the author’s views, the reflections above include contributions from Beyond AUM and ChatON AI.