Source: Morningstar; Russell, MSCI, Dow Jones, Bloomberg, ICE BoA ML benchmarks shown; past performance is not indicative of future results
Q2 2025 by the numbers
- 90 + 23 represents the original 90-day extension granted by President Trump, stemming back to early April, where he lowered the “Liberation Day” reciprocal tariff rates to 10% while allowing trade partners more time to negotiate. He has recently extended that deadline another 23 days to August 1.
- 9 is the number of all-time highs for the S&P 500 index posted in the first half of 2025. This includes a single daily increase of 9.5% on April 9, the day of the tariff-pause announcement, which is the best daily performance for the index since 2008.
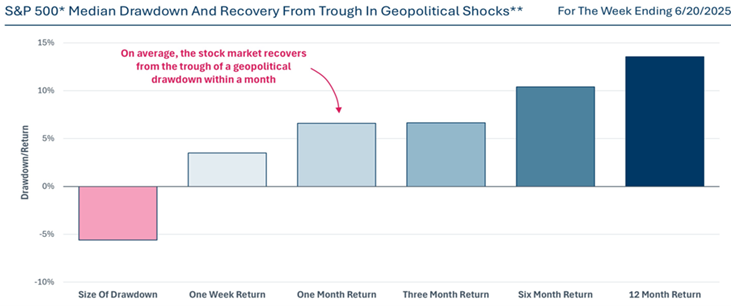
- -5.6% is the median S&P 500 index drawdown in reaction to geopolitical shocks throughout history.
- +7.2% is the YTD return of a portfolio comprised of 60% MSCI ACWI and 40% Bloomberg Global Aggregate (hedged USD). In other words, despite the unnerving headlines so far this year, a globally balanced portfolio comprised of both stocks and bonds is now outperforming the S&P 500 by 1% YTD.
An unfolding tariff timeline
- White House tariff policies continue to dominate market headlines in Q2.
- The initial pause of Liberation Day reciprocal tariffs has been further extended to give international trading partners more time to negotiate.
Like the first quarter of the year, Q2 headlines continued to be saturated by trade wars and White House tariff policies, which continue to be fluid along with responses from international trading partners.
Back in early February, the estimated effective tariff rate on U.S. imports of various goods was just under 4% according to Bloomberg and Apollo Chief Economist, Torsten Slok. On April 2, Liberation Day, this rate jumped to 23% before hitting a YTD high of 27% weeks later. This led stock and bond markets to steep declines.
After a 90-day pause brought the reciprocal tariff rate to 10% combined with progress in trade negotiations with key international partners during the following months, the effective tariff rate for the U.S. ended the quarter at 13.5%, which played a part in the rebound for stock and bond markets.
Recent tariff and trade policies represent a stark, swift change compared to recent history and may have caught many U.S. businesses by surprise. A recent quarterly survey, “The Conference Board Measure of CEO Confidence,” attempted to gauge how worried business leaders were regarding tariffs. Topics like geopolitical instability, legal and regulatory change, and general financial and economic risks have been top of mind recently among corporate leadership, but trade and tariffs are new this quarter. What was recently not on companies’ radar is now viewed as a significant risk moving forward.
Given that it’s likely tariffs and related trade policies are here to stay for at least the short term, consumers and businesses will need to decide how they will deal with the effects of tariffs.
Exhibit 1 suggests that businesses are likely to pass through at least a portion of tariff-related costs to consumers, especially in the manufacturing sector. Other companies are likely to absorb some of these costs and some businesses are likely to do some combination of both. In this scenario, it’s possible that consumers will be forced to pay higher prices and company profitability will recede, which can spur inflation and lower stock market performance going forward.
Exhibit 1
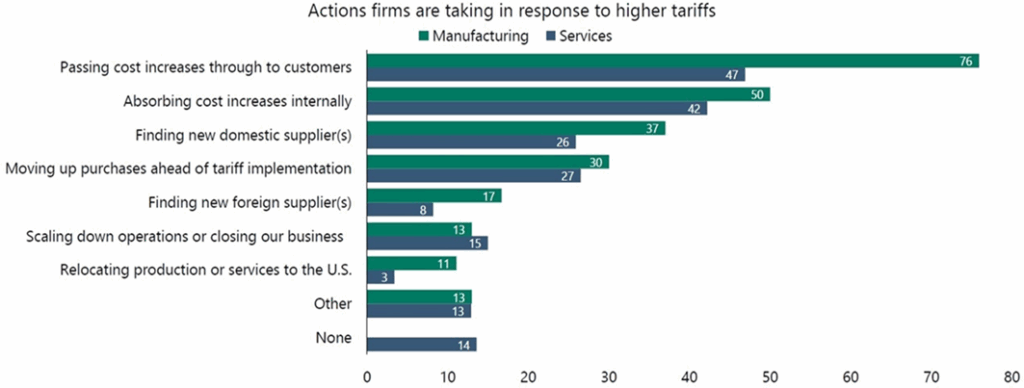
Source: Federal Reserver Bank of Dallas, Apollo Chief Economist
A wait-and see approach
Tariff uncertainty, in addition to making things difficult for businesses and consumers, can also complicate things for the Federal Reserve. So far, it’s possible that we haven’t seen the full effect of tariffs flow through to prices and inflation. The Fed’s preferred measure of inflation, the Core Personal Consumption Expenditures Index (or Core PCE), continues to hover below 3% (2.7% as of May 2025) and the unemployment rate sits near all-time lows. Given that both components of the Fed’s dual mandate of maintaining low unemployment and stable prices are below their trailing 60-year averages (5.9% unemployment and 3.2% Core PCE), it’s unlikely that the Fed will begin to cut rates quickly even if markets expect rate cuts to resume by year’s end. For now, it remains a wait-and-see approach for the Fed.
In order for the Fed to resume lowering interest rates, we would likely need to see a material downgrade in economic growth and/or the labor market, both of which have remained resilient up until now.
Geopolitical market jitters
With reigniting tensions in the Middle East between Israel and Iran beginning in May and the continued conflict between Russia and Ukraine, markets have reacted in different ways to these ongoing events. In May, as Israel and Iran began exchanging blows, markets saw the price of oil begin to swing wildly.
However, when geopolitical events occur, no matter the cause or location of the conflict, markets tend to react negatively in the short term. Exhibit 2 details how the S&P 500 index has responded to geopolitical shocks over time.
Through almost a century of geopolitical shocks, the median drawdown in response to these events has been -5.6% and has lasted only 16 days. Markets tend to recover quickly and recoup losses within a month following the event. Perhaps most interesting is that markets go on to return 14% during the 12 months following such events. Nonetheless, this reaffirms a calm long-term mindset to investing.
Exhibit 2
U.S. Equity
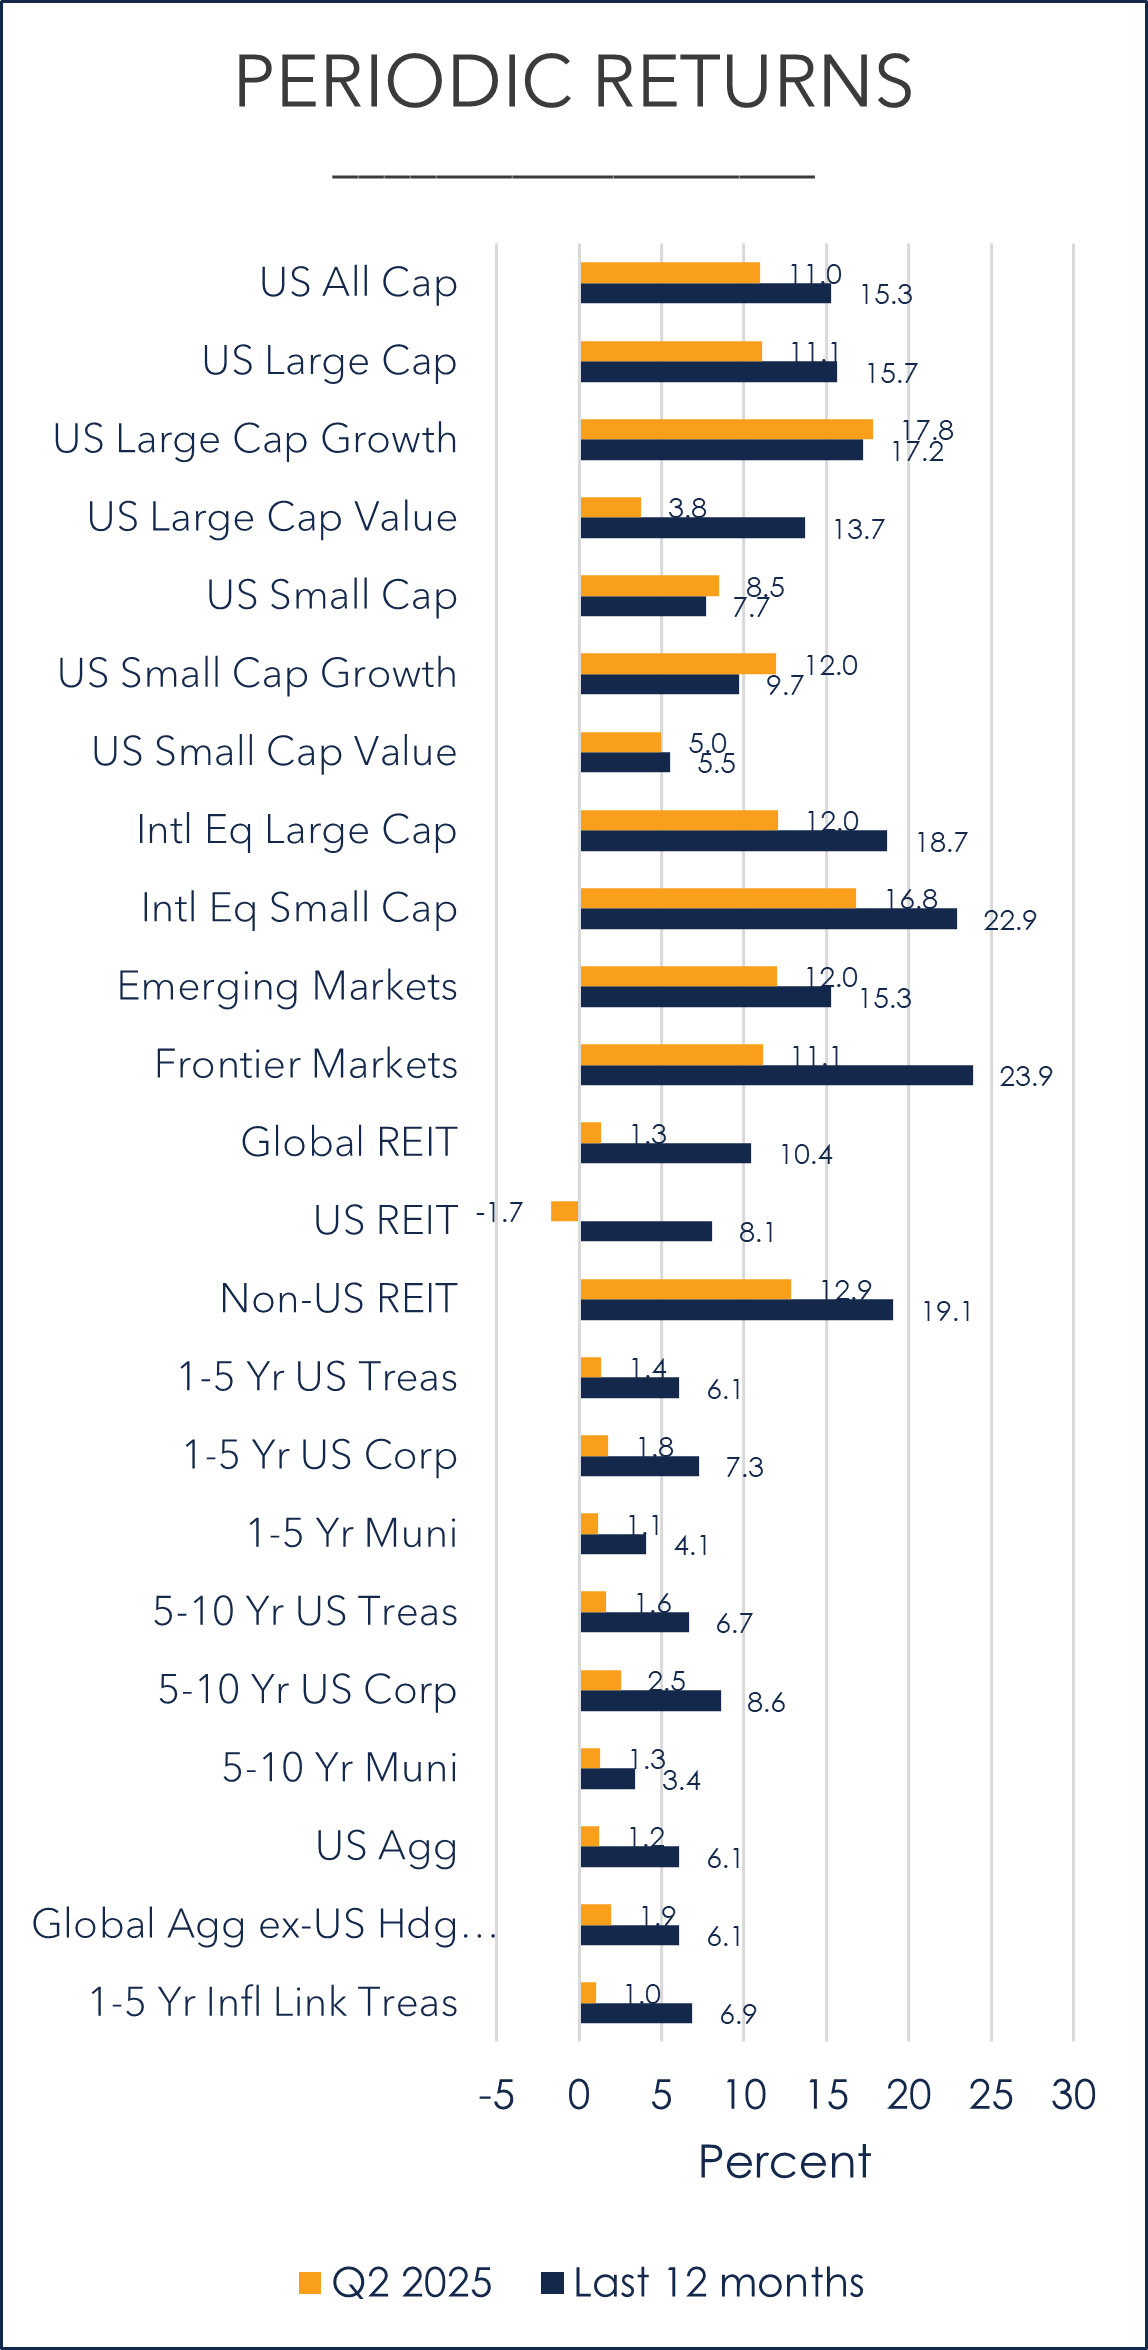
- U.S. stocks were positive for Q2 even after shaking off a rocky start in April. Large-cap growth stocks gained the most at 17.8%
- Uncertainty around tariffs and trade wars continued to weigh on small-cap stocks across valuation spectrum so far this year. Small-cap value stocks have fallen the most YTD (-3.2%).
- During the last 12 months, all U.S. stock segments are positive.
While U.S. stocks rebounded nicely in Q2 led by large-cap growth stocks, WSJ.com analysis suggests that there’s at least a little more to the story.
Extending the starting point of performance back to February 19 of this year, the prior YTD high for the U.S. stock market in Q1, we can place the stellar Q2 performance of U.S. large-cap stocks in better context. From that starting point through June 30, which encompasses the steep drawdown post-Liberation Day, only three of the seven stocks (Microsoft +22%, Nvidia +13%, Meta +3%) beat the U.S. market, which was up only 1% as represented by the Russell 3000 index. Four of the seven stocks ended the period at a loss with Apple lagging the furthest with a -16% decline.
Earlier in this period, Tesla stock was down as much as 37%! This highlights the fact that the Mag 7 companies may not be as supportive as a group as they have been in prior years as well as the fragility in a U.S.-only or concentrated stock strategy.
Non-U.S. Equity
- Developed and emerging non-US stock market returns were all positive for Q2 and all periods during the last 12 months.
- International developed large-cap value stocks returned the most during the last 12 months at 25% and have outpaced the U.S. stock market by 9.7% over the same time period.
International developed and emerging stock markets continued their upward trend from the first quarter, where value stocks across the market-cap spectrum continued to lead the way. And while this trend has heightened during the last year relative to U.S. stocks, one analysis dates this phenomenon back to the beginning of the current bull market starting in October 2022 as seen in Exhibit 3.
These charts display international stock performance by region and sector relative to different measures of U.S. stock performance. Beginning with the chart on the left, European and Japanese stocks have outperformed U.S. stocks when excluding Nvidia.
Exhibit 3
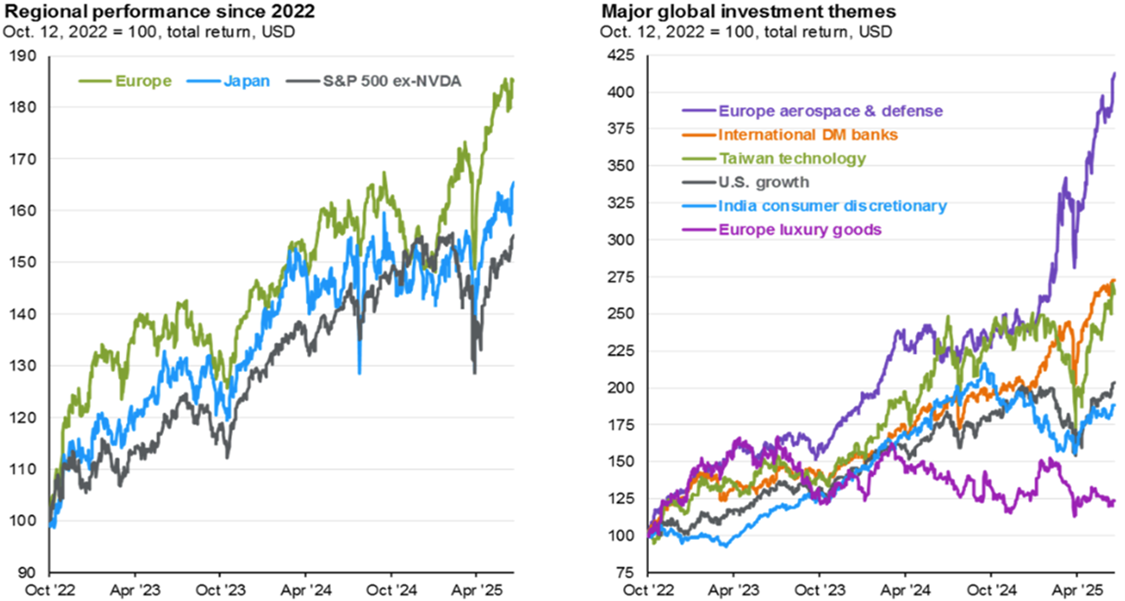
Source: FactSet, MSCI, J.P. Morgan Asset Management. 10/12/2022 was the market bottom for U.S. equities. (Right) Russell. Each country/sector/industry is represented by its respective MSCI index except U.S. growth, which is represented by the Russell 1000 Growth Index.
Similarly in the chart on the right, a few regional sectors have outperformed U.S. large-cap growth companies. European aerospace and defense companies, international banks, and Taiwanese technology companies have all benefited from recent market trends during the prior two years or more. This highlights the benefits of broad diversification by geographical regions and sectors.
The recent depreciation of the U.S. dollar has been another tailwind for international investments held by U.S. investors. When the dollar falls, international investments held in foreign currencies become more valuable when converted back to U.S. dollars. According to CNBC’s analysis of the ICE U.S. Dollar Index, this year’s -10.7% drop of the dollar marks its worst first half performance since 1973 after President Richard Nixon broke away from the Bretton Woods gold standard. Much of this decline has been attributed to factors including trade policy volatility, a ballooning federal debt and deficits, and the potential for interest rate cuts by the Fed. If these dollar headwinds are addressed going forward, the dollar could certainly reverse course, but as currency movements are notoriously difficult to predict, we would not suggest trying to change portfolio allocations in anticipation of where currencies might go next.
Global REITs (Real Estate Investment Trusts)
- Global REITs, as represented by the Dow Jones Global Select REIT, rose by 1.3% over the quarter and by 10.4% over the last 12 months.
- In the US, REITs declined -1.7% during the quarter but are still up 8.1% during the last 12 months.
Global Fixed Income
- U.S. taxable bond returns were positive during Q2, YTD, and 12-month periods with intermediate corporate bonds gaining the most during the quarter at 2.5% and the last year at 8.6%.
- Global bonds ex-US (hedged USD) were also positive over the trailing quarter (1.9%) and 12-month periods (6.1%).
- Most municipal bonds were also positive for the quarter and one-year trailing time periods with short-term munis up 4.1% for the last 12 months.
U.S. government debt downgrade
In mid-May, Moody’s followed the S&P and Fitch’s prior decisions (in 2011 and 2023 respectively) to strip the U.S. federal government of its last AAA credit rating. However, like prior credit rating downgrades, this does not necessarily spell doom and gloom for U.S. federal debt. This is not new news. Like prior downgrades, Moody’s cited the increase in government debt and rise in interest costs as cause for the downgrade, according to JPMorgan. However, yet another credit downgrade highlights a potential longer-term concern for the U.S. government debt market, and its need to reign in continued deficit spending.
A JPMorgan analysis looked at prior downgrades and the 14 trading days that followed. In 2011, 10-year yields dropped, and investment-grade credit spreads widened while in 2023 both measures increased. This year, 10-year treasury yields briefly jumped as much as 0.15% by the third trading day post-downgrade even though 10-year treasury yields finished the quarter 0.19% lower than where they were on the day of the downgrade with credit spreads also remaining relatively tight.
For now, the U.S. dollar and federal government bonds remain heavily intertwined in the global trade ecosystem. This does also provide a potential opportunity for increased bond diversification by allocating to bonds outside of the U.S.
Focusing on recent treasury yield curve changes in Exhibit 4, short-term rates, which the Fed controls, were little changed during the second quarter while longer-term yields rose slightly. However, during the last 12 months, short-to-intermediate term yields dropped, which led to positive performance in U.S. government bonds of similar maturities. Corporate bonds also benefited from credit spreads remaining relatively tight.
Regarding municipal bonds, most short-to-intermediate bonds were positive for the quarter, YTD, and trailing one-year periods. However, longer dated maturities fell during the same time periods as rates moved higher, which led to a steeper municipal yield curve overall. This highlights the fact that treasuries and municipal bonds behave differently as they are exposed to different risks.
Exhibit 4
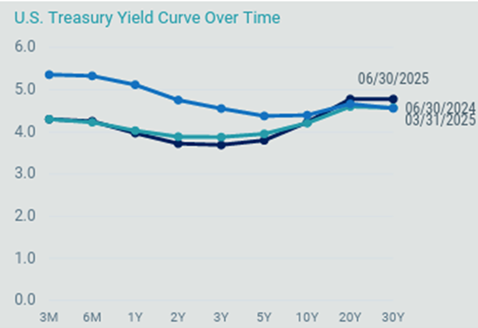
Source: Bloomberg, Avantis. Data as of 6/30/2025
Overall, we continue to view our bond allocations as a method of reducing overall portfolio risk (as measured by standard deviation), given that stocks are expected to have much higher volatility. Our portfolio’s focus will continue to be on high quality bonds with an emphasis on short to intermediate duration government and corporate bonds, where default risk has historically been relatively low.
Investment advisory services offered through Equita Financial Network, Inc. (“Equita”). Equita also markets investment advisory services under the name AegleWealth, East Bay Investment Solutions and Equita Financial Network, Inc. have an arrangement whereby East Bay Investment Solutions, a Registered Investment Advisory firm, provides model recommendations on a consulting basis to Equita Financial Network, Inc. Equita Financial Network, Inc. maintains full discretion and trading authority over its clients’ accounts.
This document contains general information, may be based on authorities that are subject to change, and is not a substitute for professional advice or services. This document does not constitute tax, consulting, business, financial, investment, legal or other professional advice, and you should consult a qualified professional advisor before taking any action based on the information herein. This document is intended for the exclusive use of clients or prospective clients of Equita Financial Network, Inc. Content is privileged and confidential. Information has been obtained by a variety of sources believed to be reliable though not independently verified. To the extent capital markets assumptions or projections are used, actual returns, volatilities and correlations will differ from assumptions. Historical and forecasted information does not include advisory fees, transaction fees, custody fees, taxes or any other expenses associated with investable products. Actual expenses will detract from performance. Past performance does not indicate future performance.
The sole purpose of this document is to inform, and it is not intended to be an offer or solicitation to purchase or sell any security, or investment or service. Investments mentioned in this document may not be suitable for investors. Before making any investment, each investor should carefully consider the risks associated with the investment and make a determination based on the investor’s own particular circumstances, that the investment is consistent with the investor’s investment objectives. Information in this document was prepared by East Bay Investment Solutions and modified by Equita. Although information in this document has been obtained from sources believed to be reliable, East Bay Investment Solutions and Equita does not guarantee its accuracy, completeness or reliability and are not responsible or liable for any direct, indirect or consequential losses from its use. Any such information may be incomplete or condensed and is subject to change without notice.
Visit eastbayis.com or more information regarding East Bay Investment Solutions.
Investment Advisory services offered through Equita Financial Network, Inc., an Investment Adviser with the U.S. Securities and Exchange Commission. Equita Financial Network also markets investment advisory services under the name AegleWealth. The foregoing content reflects our opinions and is subject to change at any time without notice. Content provided herein is for informational purposes only and should not be used or construed as investment advice or a recommendation regarding the purchase or sale of any security. There is no guarantee that the statements, opinions, or forecasts provided herein will prove to be correct. All investing involves risk, including the potential for loss of principal. There is no guarantee that any investment plan or strategy will be successful. Along with the author’s views, the reflections above include contributions from Beyond AUM and ChatON AI.