Q4 2025 by the numbers
- During 2025, the length of time between the worst and best daily performance for the S&P 500 index was only 5 days (in April). Investors who got out of the market after the worst day (-6.0%) may not have seen its best day (+9.5%) a short time later.
- Heading into 2025, the average miss of a group of Wall Street analysts when predicting future year S&P 500 performance heading into 2025 was 18% (covering the last seven years).
- 50% is the Mag 7’s share of performance contribution to the S&P 500 index in 2025 highlighting the important role other index companies play in diversification and return generation. That being said, only 2 of the Mag 7 stocks outperformed the S&P 500 for 2025.
- +15.1% is the 2025 return of a portfolio comprised of 60% MSCI ACWI and 40% Bloomberg Global Aggregate (hedged USD). In other words, despite the unnerving headlines during the year, a globally balanced portfolio comprised of both stocks and bonds trailed the S&P 500 by only 2.8% this year.
A divergent economy
- Inflation-adjusted U.S. GDP growth accelerated to 4.3%, which is up meaningfully from prior quarters.
- Employment growth slowed substantially in 2025 and added only 49,000 jobs a month relative to 168,000 in 2024.
2025 marked a year of meaningful economic productivity with strong growth taking place in the face of heightened geopolitical and trade uncertainty. Yet, the unemployment rate also began to steadily rise throughout the year and reached a multi-year high of 4.6% in November before being revised downward in December.
These trends are illustrated in Exhibit 1, which displays recent changes in U.S. key economic indicators of inflation, GDP growth, and unemployment.
Beginning with GDP growth in the middle of Exhibit 1, the chart shows strong growth for the U.S. economy with a most recent annualized reading of 4.3%, which outpaces growth rates from the prior quarter and prior year. Tariffs have played a significant role in this recent growth trend as U.S. consumers and producers turn toward U.S. sources for their consumption and production needs because importing goods from abroad has become more expensive as a result of tariff policies. Another tailwind comes in the form of artificial intelligence spending by large, tech-oriented U.S. companies. According to consulting firm McKinsey, cumulative AI-related spending efforts are expected to reach a cumulative $6.7 trillion during the next five years with a focus on data center construction and energy supply. In addition, government spending through fiscal policy remains strong. The recent passage of the One Big Beautiful Bill Act is expected to boost GDP growth by 0.9% in 2026 according to the Congressional Budget Office.
Shifting attention to the unemployment rate trends on the right of Exhibit 1, the U.S. labor market has begun to weaken during the course of 2025 although remains strong by historical standards. This uptick in unemployment seems to run counter to recent strong economic growth. A potential answer to this paradox is that the adoption of artificial intelligence is lessening the traditional demand for labor while also increasing economic productivity. In addition, the labor supply has decreased with stricter immigration controls and elevated deportations. Lastly, government employment has also contracted. This leads to a steady increase in the overall unemployment rate. This weakening labor market was widely cited by the Fed as a reason for the three 0.25% rate cuts for 2025, but with continually stubborn inflation, the Fed will need to see further sustained lowering in inflation and/or a material increase in unemployment before considering further interest rate cuts.
Exhibit 1
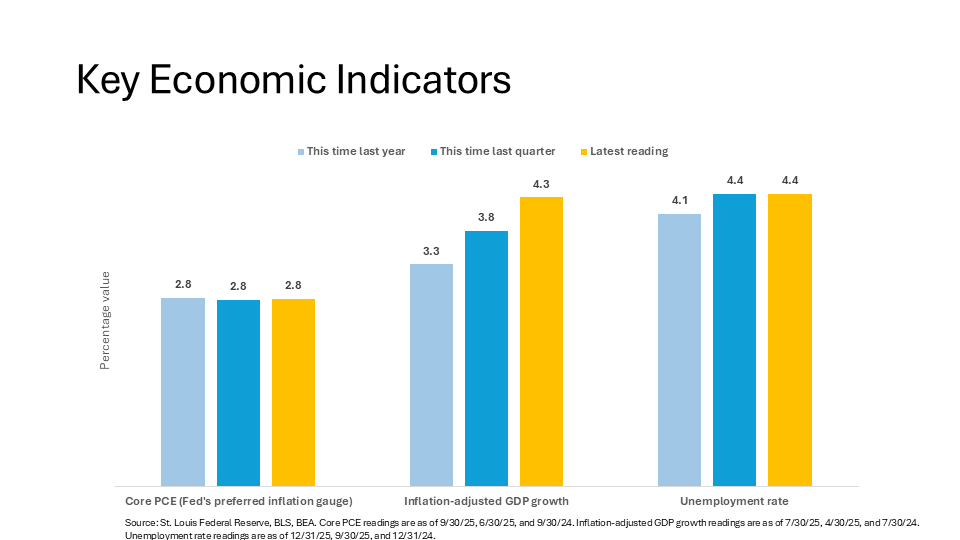
Source: St. Louis Federal Reserve, BLS, BEA. Core PCE readings are as of 9/30/25, 6/30/25, and 9/30/24. Inflation-adjusted GDP growth readings are as of 7/30/25, 4/30/25, and 7/30/24. Unemployment rate readings are as of 12/31/25, 9/30/25, and 12/31/24.
Productivity and fiscal sustainability
Given these trends in economic data points—moderate inflation, strong growth, and contained unemployment—it’s fair to say that the U.S. is on solid ground economically. However, pairing these trends with a continually increasing level of government debt and deficit spending, there may lay an uncertain future ahead for the U.S. Treasury market.
The U.S. federal government has been spending on deficit, which means government expenditure has exceeded tax revenue collected, for the last several decades and has seen its national debt rise commensurately. And while GDP has been strong recently, it has grown far slower resulting in a rising debt-to-GDP ratio. The larger the ratio is, the more a country’s economy is fueled by government debt.
When looking at the changing shape of the U.S. Treasury yield curve during the last 25 years, there is at least a bit of evidence to suggest that the U.S. economy currently finds itself on an unsustainable path.
Exhibit 2 examines the current Federal Reserve rate cutting cycle, which began in 2024, and compares it to three prior rate cutting cycles, beginning in 2001, and looks at how interest rates on longer-dated Treasury bonds responded during those periods. Keep in mind that ultrashort-term rates, which the Fed controls, do not directly influence longer-term bonds, like the 10-year Treasury, in any predictable sense. But the last three rate cutting cycles show that the 10-year yield moved in the same direction each time by different amounts. The current rate cutting campaign has seen different results so far with the 10-year Treasury yield increasing by about 0.25% to end 2025 relative to September 2024.
This trend suggests that investors are starting to look well into the future and are potentially beginning to question the U.S. government’s ballooning fiscal circumstances. If and when the level of U.S. deficit spending and overall debt load is perceived as more unsustainable than not by investors, yields of all treasury bond maturities could increase dramatically. However, interest rates across short and intermediate portions of the treasury yield curve decreased during 2025.
As always, the future is unknowable and there are many possible outcomes to this scenario. The potential for transformational changes in productivity stemming from artificial intelligence could very well boost GDP to grow faster than government debt and lessen debt-to-GDP ratios going forward improving fiscal sustainability. This also presents an opportunity for investors to diversify their bond portfolios globally (USD hedged).
Exhibit 2
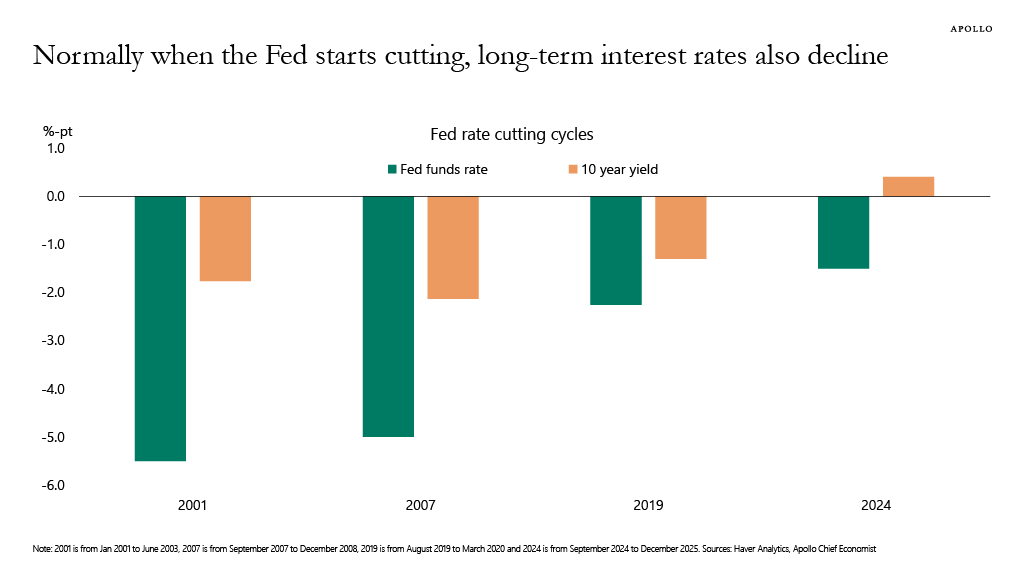
Source: Haver Analytics, Apollo Chief Economist. 2001 is from Jan 2001 to June 2003, 2007 is from September 2007 to December 2008, 2019 is from August 2019 to March 2020 and 2024 is from September 2024 to December 2025.
U.S. Equity
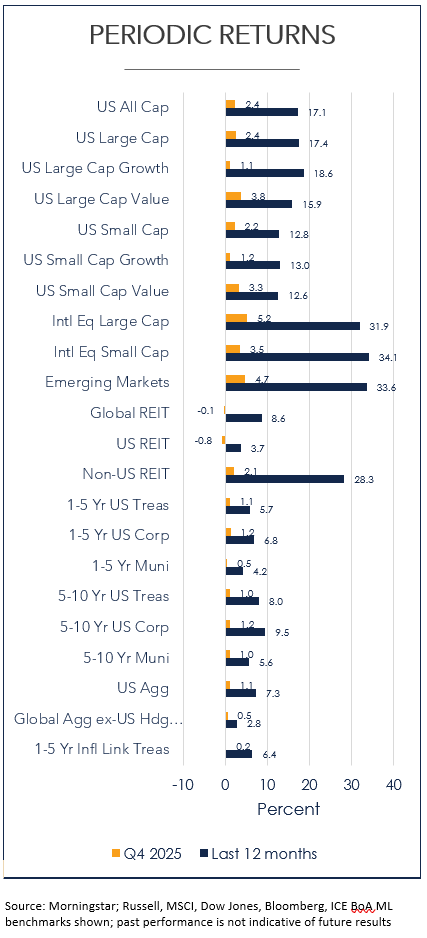
- U.S. stocks were positive for Q4 gaining 2.4% spurred in part by value stocks. Large-cap value stocks gained the most at 3.8%.
- Large-cap growth stocks fueled growth in U.S. stock markets in 2025 returning the most of any U.S. stock asset class in 2025 at 18.6%
- All U.S. stock asset classes were positive in 2025 with only a 6% difference between the best and worst performing asset class.
Looking back on 2025 through the lens of U.S. stocks, it was another notable year to say the least with the S&P 500 index returning a formidable 17.9%. However, that end-of-year return figure doesn’t come close to telling the whole story. A year that ended with strong performance had multiple drawdowns associated with tariffs and the spending of artificial intelligence related companies. The steepest drawdown was -18.7% that began in February and accelerated in April around Liberation Day. Investors who got out of the market or changed their strategy around that market bottom could not benefit from the market’s almost 40% recovery to end the year. 2025 provided another valuable lesson to investors that market timing is a difficult and unreliable endeavor.
Yet another way to examine 2025 U.S. stock performance is looking at beginning-of-year expectations versus reality. There is an annual Wall Street tradition that calls for analysts and market gurus to estimate what the next year will bring for S&P 500 index performance. According to analysis by Avantis, median annual predictions by a group of stock analysts heading into each of the last seven years prior to 2025 missed by about 18% on average relative to what ended up occurring. Analyst predictions for S&P 500 performance heading into 2025 was 12.2%, which was off by 5.7%. And while this is a marked improvement relative to the last several years, listening to financial media and analyst predictions has proven to be a fickle way to make investment decisions.
Yet another cross-section of S&P 500 performance can be examined by looking at the performance of notable large-tech related companies, known as the Magnificent 7, and comparing their performance to that of the remainder of S&P 500 companies, referred to by some as the S&P 493. While it’s true that the performance of this index and the U.S. stock market as a whole was heavily influenced by the performance of MAG 7 companies like NVIDIA and Google’s parent company Alphabet, it may be surprising to hear that those two stocks were the only two of the Mag 7 to outperform the S&P 500 during 2025. The remainder of the Mag 7 underperformed the index by up to 12.7% with Amazon trailing the furthest. There were a number of companies that outperformed the S&P 500 and the MAG7, some by wide margins, across sectors and industries. While their share of the overall index return was smaller on an individual company basis, the collective S&P 493 were still responsible for half of the overall S&P 500 index return.
Non-U.S. Equity
- Developed and emerging non-US stock market returns were all positive for Q4 and 2025.
- International developed large-cap value stocks returned the most of any global asset class during 2025 at 42.2% while emerging market stocks returned 33.6%, outpacing U.S. and international developed large cap stocks.
A discussion of 2025 stock market performance would be far from complete without looking at performance of stock markets outside of the U.S. As Exhbit 3 shows, International developed markets outpaced the U.S. stock market by double digits for the year for the first time in quite a while on a rolling one-year basis. Since late 2009 to be exact. This chart depicts the relative performance between the U.S. and international developed stock markets on a rolling one-year basis. Positive values indicate that international markets outperformed U.S. markets and vice versa for negative values. As this chart displays, each region has gone through periods of over and underperformance relative to the other, and that the magnitudes of this relative performance can be dramatic at times. For much of the 2010s and beyond, the U.S. stock market has bested its international counterparts.
Exhibit 3
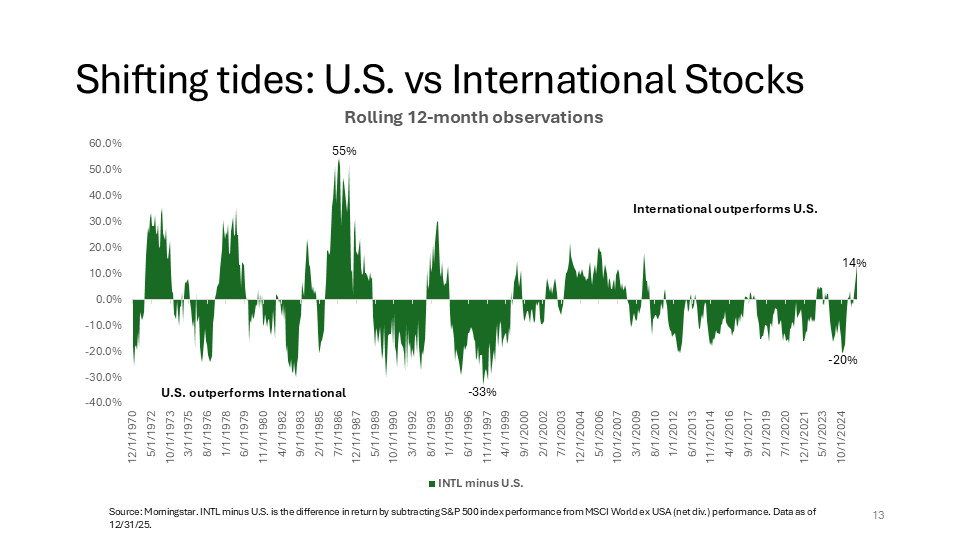
Source: Morningstar. INTL minus U.S. is the difference in return by subtracting S&P 500 index performance from MSCI World ex USA (net div.) performance. Data as of 12/31/25.
So, what has changed to cause this recent phenomenon? At least part of international stocks’ recent success can be attributed to the decline in the value of the U.S. dollar. Because international investments are priced in their local foreign currencies, when the dollar weakens relative to those currencies, the value of foreign investments rise all else equal. The opposite is also true. And while the dollar declined about 10% over the course of 2025, that leaves an incomplete picture of what drove international performance. According to Goldman Sachs analysis, several international developed stock markets outpaced the U.S. without adjusting for currency effects. A significant part of this growth came from foreign government spending on defense, infrastructure, energy, and technology as well as investors potentially viewing international markets as underpriced and more affordable relative to the U.S. market. No matter the cause, these sorts of performance trends reinforce the idea of global diversification because it can’t be known with certainty which region will go on to outperform in the future.
Global REITs (Real Estate Investment Trusts)
- Global REITs, as represented by the Dow Jones Global Select REIT, declined by -0.1% over the quarter but were up by 8.6% over the last 12 months.
- In the US, REITs declined by -0.8% during the quarter but are up by 3.7% during the last 12 months.
Global Fixed Income
- U.S. taxable bond returns were mostly positive during Q4 and 12-month periods with intermediate corporate bonds gaining the most during the quarter at 1.2% and last year at 9.5%.
- International bonds ex-US (hedged USD) were also positive over the trailing quarter (0.5%) and 12-month periods (2.8%).
- Short-to-intermediate-term municipal bonds were also positive for the quarter and one-year trailing time periods with intermediate-term munis up 5.6% for the last 12 months.
Focusing on recent Treasury yield curve changes in Exhibit 4, short term rates, which the Fed controls, fell over the quarter and year along with intermediate rates while longer term yields rose slightly for the year. You can also see that the shorter portion of the curve is still flat-to-inverted but begins to steepen on the longer end.
Exhibit 4
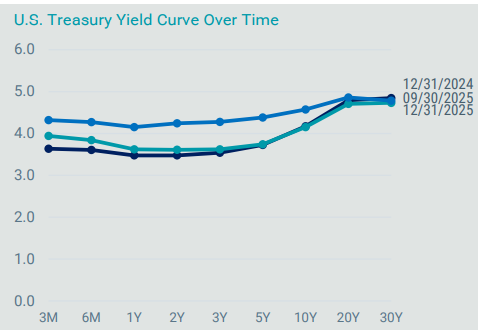
Source: Bloomberg, Avantis. Data as of 12/31/2025
Regarding municipal bonds, bond returns of all maturities were positive for the quarter and trailing one-year periods as yields fell across the curve on average over the year. This highlights the fact that Treasuries and municipal bonds behave differently as they are exposed to different risks.
Overall, we continue to view our bond allocations as a method of reducing overall portfolio risk (as measured by standard deviation), given that stocks are expected to have much higher volatility. Our portfolio’s focus will continue to be on high quality bonds with an emphasis on short to intermediate duration government and corporate bonds, where default risk has historically been relatively low.
East Bay Investment Solutions, a Registered Investment Advisory firm, supplies investment research services under contract.
Investment advisory services offered through Equita Financial Network, Inc. (“Equita”). Equita also markets investment advisory services under the name AegleWealth LLC. East Bay Investment Solutions and Equita Financial Network, Inc. have an arrangement whereby East Bay Investment Solutions, a Registered Investment Advisory firm, provides model recommendations on a consulting basis to Equita Financial Network, Inc. Equita Financial Network, Inc. maintains full discretion and trading authority over its clients’ accounts.
East Bay Investment Solutions and AegleWealth LLC are independent from and unaffiliated with each other; however, AegleWealth LLC has engaged East Bay Investment Solutions to provide nondiscretionary investment portfolio recommendations. AegleWealth LLC, to the exclusion of East Bay Investment Solutions, retains the discretionary authority to accept or reject East Bay Investment Solutions’ investment portfolio recommendations with respect to its clients’ accounts.
This material contains general information, may be based on authorities that are subject to change, and is not a substitute for professional advice or services. This material does not constitute tax, consulting, business, financial, investment, legal or other professional advice, and you should consult a qualified professional advisor before taking any action based on the information herein. This material is confidential and intended for the exclusive use of clients or prospective clients of AegleWealth LLC. Information has been obtained from a variety of sources believed to be reliable though not independently verified. To the extent capital markets assumptions or projections are used, actual returns, volatilities and correlations will differ from assumptions. Historical and forecasted information does not include advisory fees, transaction fees, custody fees, taxes or any other expenses associated with investable products. Actual fees and expenses will detract from performance. Past performance does not indicate future performance.
The sole purpose of this material is to inform, and it is not intended to be an offer or solicitation to purchase or sell any security or other investment product. Investments mentioned in this material may not be suitable for all investors. Before making any investment, each investor should carefully consider the risks associated with the investment and make a determination based on the investor’s own particular circumstances, and carefully consider whether the investment is consistent with the investor’s investment objectives.
Certain information in this material was originally prepared by East Bay Investment Solutions and subsequently modified or altered by AegleWealth LLC. East Bay Investment Solutions has not reviewed, approved, or endorsed any subsequent modifications by AegleWealth LLC. Although information in this material has been obtained from sources believed to be reliable, East Bay Investment Solutions does not guarantee its accuracy, completeness or reliability and are not responsible or liable for any direct, indirect or consequential losses from its use. Any such information may be incomplete or condensed and is subject to change without notice.
Investment Advisory services offered through Equita Financial Network, Inc., an Investment Adviser with the U.S. Securities and Exchange Commission. Equita Financial Network also markets investment advisory services under the name AegleWealth. The foregoing content reflects our opinions and is subject to change at any time without notice. Content provided herein is for informational purposes only and should not be used or construed as investment advice or a recommendation regarding the purchase or sale of any security. There is no guarantee that the statements, opinions, or forecasts provided herein will prove to be correct. All investing involves risk, including the potential for loss of principal. There is no guarantee that any investment plan or strategy will be successful. Along with the author’s views, the reflections above include contributions from Beyond AUM and ChatON AI.