
Fitch Ratings downgraded US government credit rating
On August 1, 2023, Fitch Ratings downgraded the US government’s credit rating to AA+ from AAA citing a “steady deterioration in standard of governance” over the past 20 years, highlighting this was more of an erosion vs. anything that suddenly caused this change. For reference, Fitch Ratings is one of three major credit rating agencies. S&P is another agency, and they actually downgraded US government credit quality back in 2011, while Moody’s, the third agency, still has the US with a AAA rating. A lower rating (or an even lower rating in the future) could not only impact the US’ ability to borrow in the future, but it could also create higher borrowing costs, which could have an impact on investments, but also fiscal, taxation, and other Federal policies. Despite the downgrades, we still view US Treasuries among the most liquid and safest bonds in the world.
US government avoided a shutdown, for now
Speaking of governance, Congress came to a compromise at the end of September to avoid a government shutdown, at least for now, as the bill just signed only funds the government through November 17, 2023. Should investors be concerned about a shutdown having a significant negative impact on the economy and markets? No, if history is any indication. Overall, there have been 21 government shutdowns since 1976. and one could classify the mixed market results as noise. In summary, of the 21 previous shutdowns, 11 saw the S&P move in a positive direction during the shutdown with nine experiencing declines (one shutdown occurred overnight, when markets were closed, so there was no market impact).
Remember, the potential economic or market fallout from a government shutdown is very different vs. the potential for what could have occurred during the debt ceiling debate, where the US could have defaulted on their debt, which likely would have had a more significant impact.
An update on US inflation and the Fed
Year-over-year inflation data in August was mixed (there are various measures of inflation). Regardless of which inflation measure you look at, Exhibit 1 clearly shows all of them are above the Fed’s 2% inflation target.
Exhibit 1:
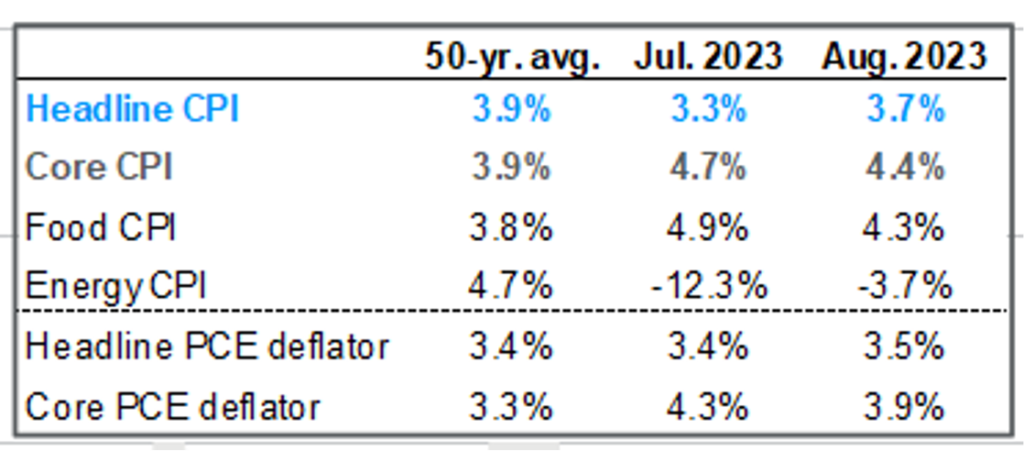
Source: BLS, FactSet, J.P. Morgan Asset Management. CPI used is CPI-U and values shown are % change vs. one year ago. Core CPI is defined as CPI excluding food and energy prices. The Personal Consumption Expenditure (PCE) deflator employs an evolving chain-weighted basket of consumer expenditures instead of the fixed-weight basket used in CPI calculations. Guide to the Markets – U.S. Data are as of 9/30/2023.
With inflation still higher than desired, and with a labor market that remains tight, the data-driven Fed increased the Fed Funds rate by 25 bps (0.25%) in July but decided to hit the pause button on another increase during their September meeting. They have continued to promote the idea that even though inflation has moderated from last year’s highs, there is still a long way to go to hit their 2% target, and that investors should prepare for more hikes in the future.
Currently, investors are expecting one more rate increase at one of the Fed’s two remaining sessions in 2023. Similarly, the Fed has suggested that they will keep the Fed Funds rate higher for longer, meaning they are not expecting to cut rates soon, unless there is some market incident that forces their hand.
U.S. Stocks
- All US stock indexes fell for the quarter, with large cap stocks outperforming smaller ones.
- Large growth stocks have the highest year-to-date (YTD) returns (+25.0%), but returns are only being driven by a few stocks.
To illustrate the second bullet, let’s look a little closer at the S&P 500. On a YTD basis, its 13.1% return looks great. However, when you look a little deeper, the returns are really being driven by just 7 stocks. As you can see from this post from Apollo Global Management on 9/22/2023, they refer to the S&P 7 and S&P 493, highlighting how differently each segment behaved YTD.
While the S&P 500 is one of the more common large cap stock indexes, the Russell 2000 (or R2000) is one of the more common indexes for small cap stocks.
Exhibit 2:
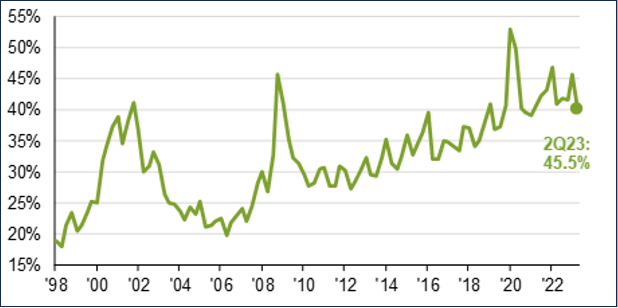
Source: Source: Compustat, FactSet, FTSE Russell, NBER, J.P. Morgan Asset Management. The S&P 500 is used for large cap and the Russell 2000 is used for small cap. Guide to the Markets – U.S. Data are as of September 30, 2023. 1Q98-2Q23, pro-forma EPS
A challenge for the Russell 2000, and one of the reasons why we it isn’t one of our favorite indexes to track for investment purposes, is that as of quarter end, 45.5% of the companies held in the Russell 2000 (roughly 900 companies) are not profitable (see Exhibit 2). It just makes economic sense that, over time, companies that are profitable should outperform companies that are not profitable. Ultimately, if a company keeps losing money, it may not be in business for very long.
A preferred approach, in particular in small cap stocks, is to focus on companies that are more profitable vs. those that are not. As a comparison, the S&P 600 is another index that invests in small cap stocks, yet unlike the R2000, it does include a positive earnings requirement, which is a fair, even if imperfect, proxy for profitability in its index construction rules. If you look at the last 20 years ending 9/30/2023, the S&P 600 has earned 1.5% more per year on average vs. the R2000. While we cannot attribute the entire difference to just the S&P’s inclusion of profitability, we do believe it is an important component.
Non-U.S. Equity
- Non-US developed large cap stocks underperformed their US counterparts over the quarter, but non-US developed small cap stocks outperformed US small caps.
- A strengthening dollar negatively impacted non-US stock index returns.
- Even with the poor quarter, global stocks as represented by the MSCI ACWI, are still up 10.1% YTD.
Unlike the S&P 500, whose return is dominated by just a few stocks, international indexes are currently more balanced and diversified. Per Exhibit 3, if you held the largest 15 stocks in the STOXX 600 (representative of European stocks), the YTD return through 9/17/2023 was 14% vs. 10% for the entire index. Similarly, the TOPIX (Tokyo Stock Exchange) also shows considerably less concentration regarding its overall return being driven by the top 15 holdings. Overall, a market that has more breadth of winners is often believed to be a healthier market.
Exhibit 3:
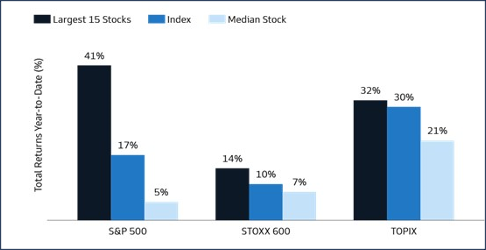
Source: Bloomberg and GS Asset Management, as of September 17, 2023. Past performance is not indicative of future results.
The rising US Dollar relative to foreign currencies was another factor in the quarterly underperformance of non-US stocks relative to US stocks. To put this in numeric terms, let’s look at a common non-US benchmark, the MSCI World ex USA. The return of the index in dollar terms (which is what a US investor would receive assuming the return is unhedged) over the previous quarter was -4.1%, but it was -1.35% in local currency terms. In other words, the stronger dollar cost US investors 2.75% in return over the last three months.
Recently, there have been plenty of negative headlines related to China, both political and economic, resulting in inquiries about possibly divesting from Chinese stocks. As we have previously noted, China constitutes roughly 1/3 of emerging markets stocks and is the second largest economy in the world, making it sort of a big “call” to exclude such a large player. Plus, if you remove China from an emerging markets allocation, the unintended impact is that you now overweight all the remaining countries, which may not necessarily provide a better outcome. Overall, it is not our general approach to make “bets” for or against specific countries and would recommend staying invested as long as Chinese markets remain open and don’t have issues with market pricing.
Global REITs (Real Estate Investment Trusts)
- Global REITs, as represented by the Dow Jones Global Select REIT, fell -6.6% for the quarter but are still up 2.6% over the last 12 months.
- US REITs slid -7.4% for the quarter while non-US REITs fared better, though were still negative, losing -4.0%.
- From a sector standpoint, most REIT sectors are down YTD with the exception of a few including data centers (16%) and health care (3%). Source: NAREIT
Global Fixed Income
- With yields rising across the Treasury curve over the quarter, fixed income indexes declined with longer duration bonds being hurt more than shorter duration bonds.
- Most bond indexes are positive over the last 12 months with the exception of intermediate and long-term Treasuries.
Fixed income investors expect to be compensated for holding longer maturity bonds vs. shorter maturity bonds, which is known as the term premium. As short-term yields rose, we saw an even greater increase in yields over the quarter across the intermediate and longer-term parts of the yield curve.
More specifically, the 10-Yr Treasury is a barometer of sorts as it can be used as a benchmark to measure investor confidence, but it’s also important because it influences rates set for mortgages and other types of debt.
For reference, the 10 Yr Treasury was yielding 4.59% at the end of September 2023, 3.83% a year earlier, and a paltry 0.69% three years ago, when outlooks were not so rosy in the middle of the pandemic. Despite the recent rise in yields, as Exhibit 4 shows, the 10 Yr Treasury still hasn’t reached the 9/30/23 level since October 16, 2007, when it closed at 4.66%. As a reminder, as yields rise, prices fall, and this is the dynamic impacting bond investors over these recent periods of rising yields.
Exhibit 4:
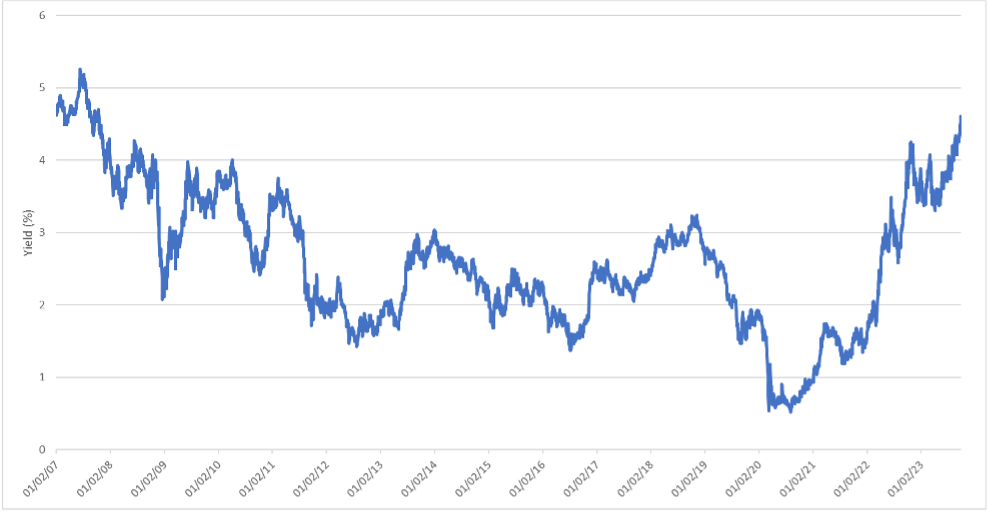
Source: US Department of the Treasury, data through September 29, 2023. Y-axis shows % yield. X-axis shows time
Nonetheless, we continue to view fixed income as a method of reducing overall portfolio risk (as measured by standard deviation), given that equities are expected to have much higher volatility. Our portfolio’s focus will continue to be on high quality bonds with an emphasis on short to intermediate duration government and corporate bonds, where default risk has historically been relatively low.
Investment advisory services offered through Equita Financial Network, Inc. (“Equita”). Equita also markets investment advisory services under the name AegleWealth LLC. East Bay Investment Solutions and Equita Financial Network, Inc. have an arrangement whereby East Bay Investment Solutions, a Registered Investment Advisory firm, provides model recommendations on a consulting basis to Equita Financial Network, Inc. Equita Financial Network, Inc. maintains full discretion and trading authority over its clients’ accounts.
This document contains general information, may be based on authorities that are subject to change, and is not a substitute for professional advice or services. This document does not constitute tax, consulting, business, financial, investment, legal or other professional advice, and you should consult a qualified professional advisor before taking any action based on the information herein. This document is intended for the exclusive use of clients or prospective clients of Equita Financial Network, Inc. Content is privileged and confidential. Information has been obtained by a variety of sources believed to be reliable though not independently verified. To the extent capital markets assumptions or projections are used, actual returns, volatilities and correlations will differ from assumptions. Historical and forecasted information does not include advisory fees, transaction fees, custody fees, taxes or any other expenses associated with investable products. Actual expenses will detract from performance. Past performance does not indicate future performance.
The sole purpose of this document is to inform, and it is not intended to be an offer or solicitation to purchase or sell any security, or investment or service. Investments mentioned in this document may not be suitable for investors. Before making any investment, each investor should carefully consider the risks associated with the investment and make a determination based on the investor’s own particular circumstances, that the investment is consistent with the investor’s investment objectives. Information in this document was prepared by East Bay Investment Solutions, and modified by Equita. Although information in this document has been obtained from sources believed to be reliable, East Bay Investment Solutions and Equita does not guarantee its accuracy, completeness or reliability and are not responsible or liable for any direct, indirect or consequential losses from its use. Any such information may be incomplete or condensed and is subject to change without notice.
Visit eastbayis.com or more information regarding East Bay Investment Solutions.
Investment Advisory services offered through Equita Financial Network, Inc., an Investment Adviser with the U.S. Securities and Exchange Commission. Equita Financial Network also markets investment advisory services under the name AegleWealth. The foregoing content reflects our opinions and is subject to change at any time without notice. Content provided herein is for informational purposes only and should not be used or construed as investment advice or a recommendation regarding the purchase or sale of any security. There is no guarantee that the statements, opinions, or forecasts provided herein will prove to be correct. All investing involves risk, including the potential for loss of principal. There is no guarantee that any investment plan or strategy will be successful. Along with the author’s views, the reflections above include contributions from Beyond AUM and ChatON AI.