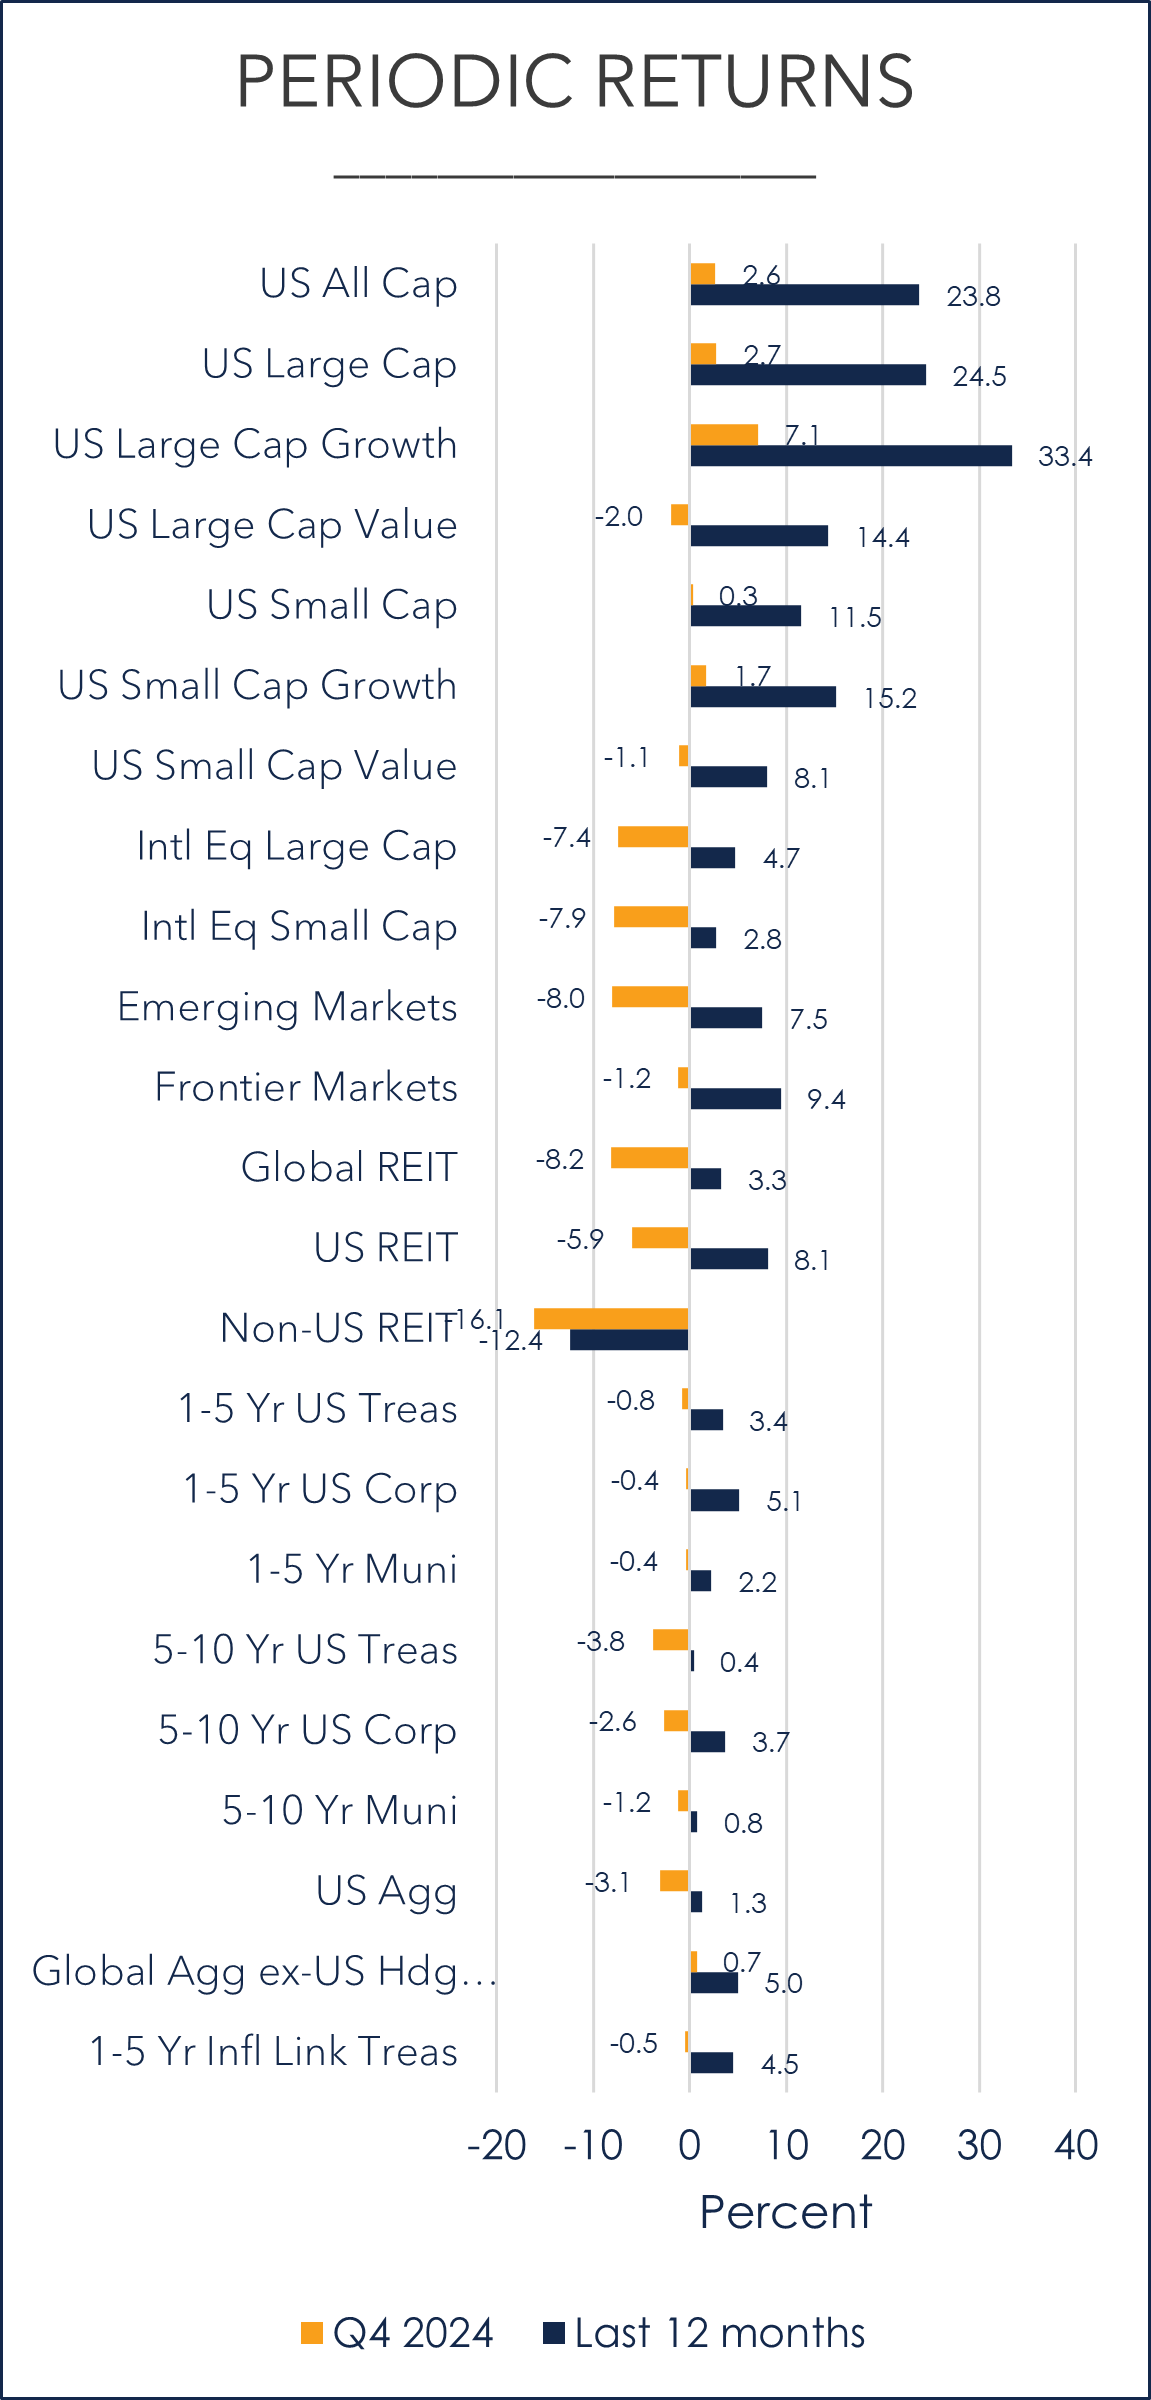
Source: Morningstar; Russel, MSCI, Dow Jones, Bloomberg, ICE BoA ML benchmarks shown; past performances is not indicative of future results.
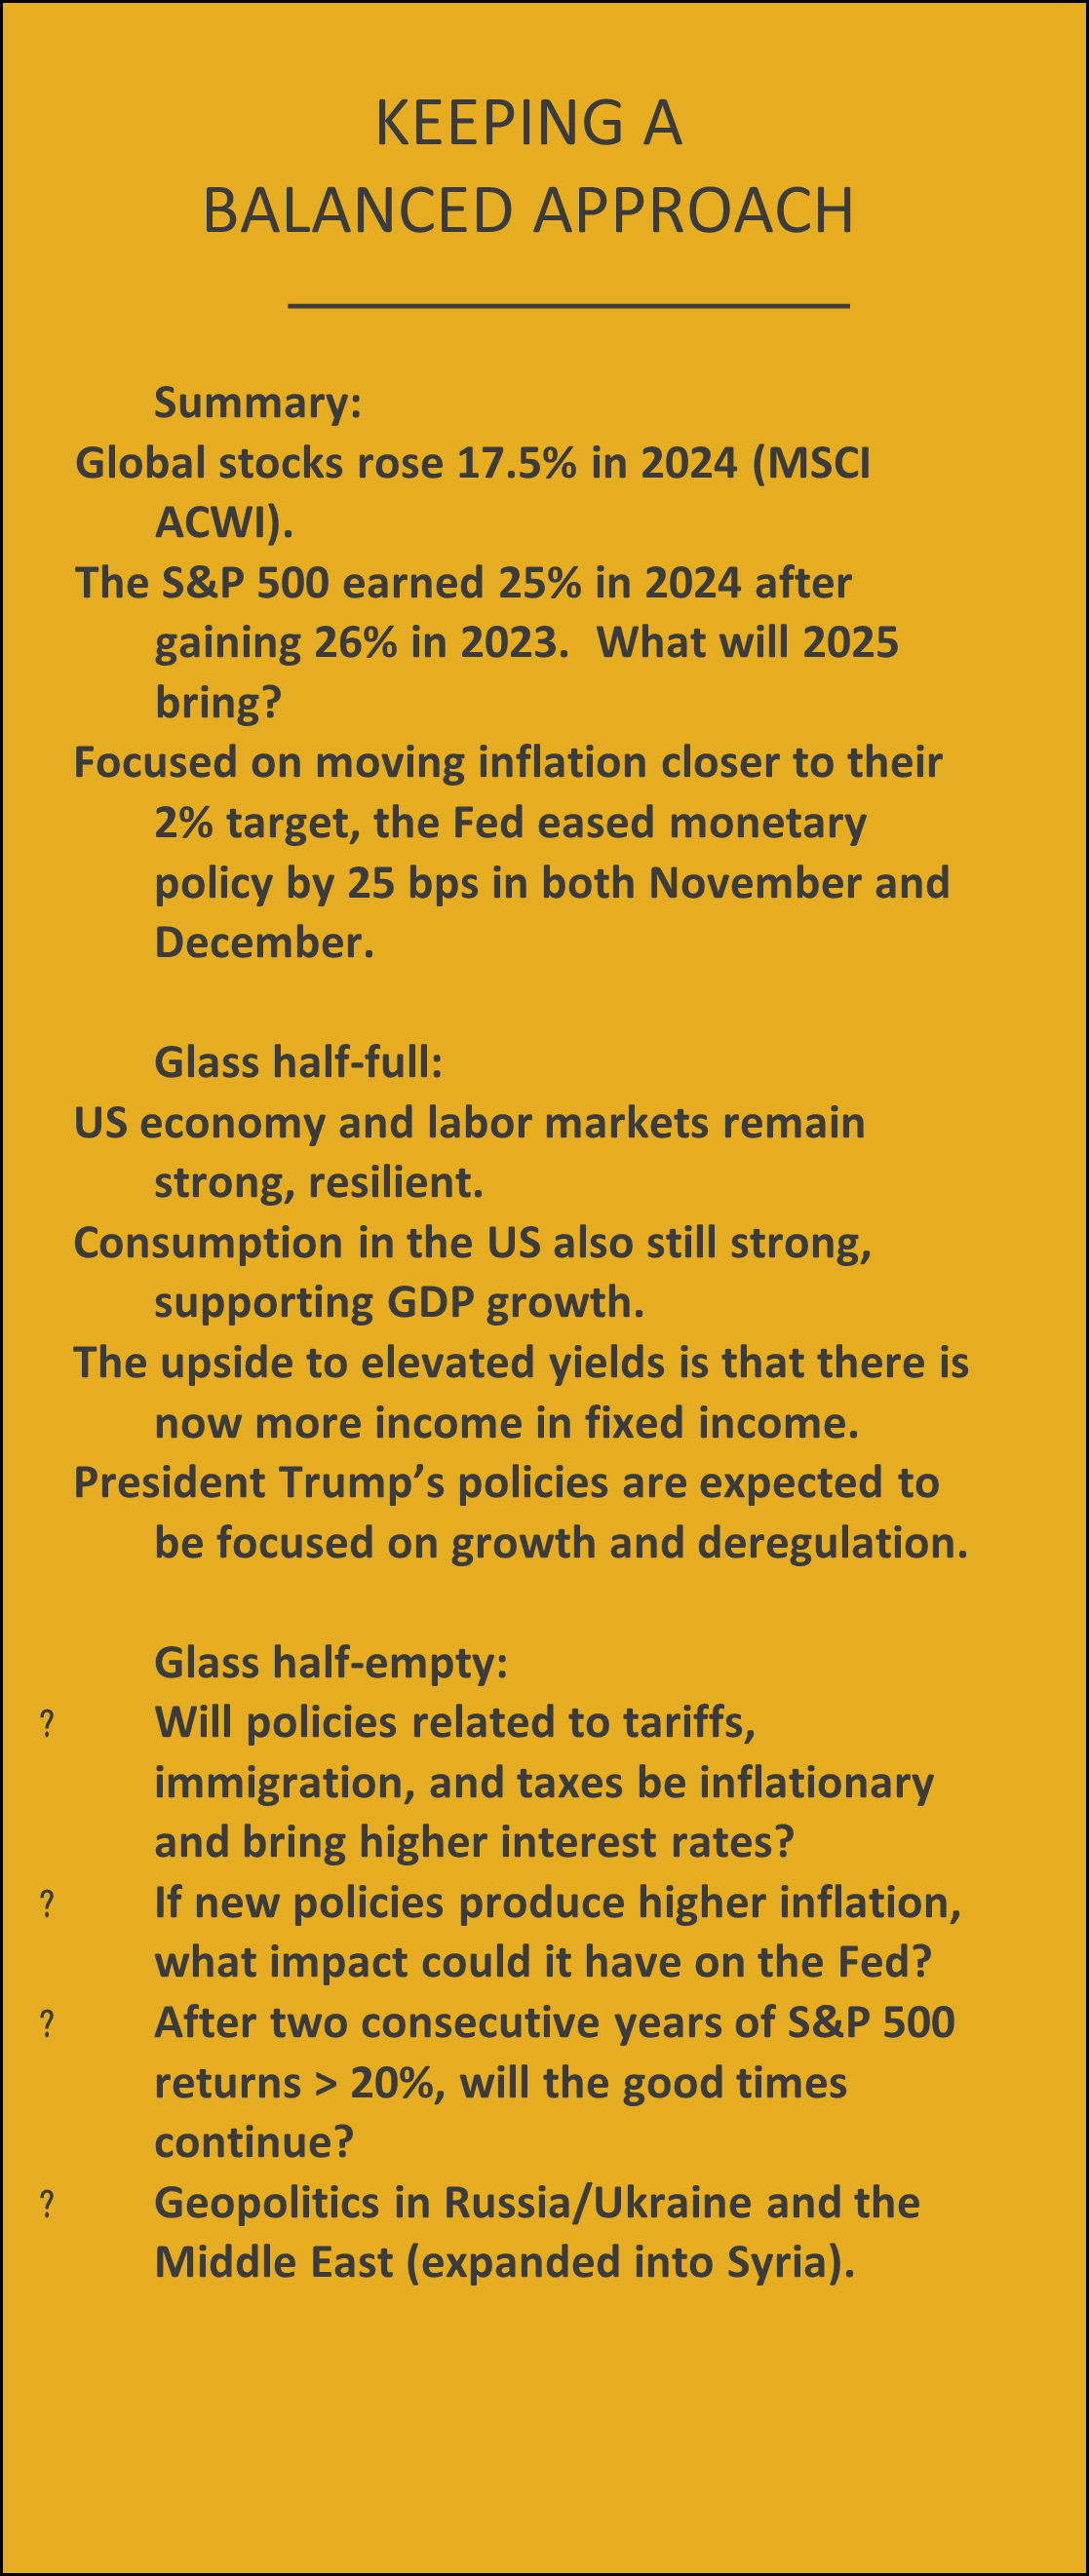
Q4 2024 by the numbers
- 4.25% – 4.50% is the new Fed policy rate as they continued reducing rates by 25 bps in both November and December. The Fed is trying to engineer a soft landing, which is an environment with low inflation and low unemployment.
- 2.7% and 2.4% were the November 2024 headline CPI and PCE figures, slightly above the 2.6% and 2.3% figures from October.
- 67% is the percentage that US stocks comprise of the MSCI ACWI, a global stock index. For reference, the US percentage was closer to 40% in 2007. We still believe holding international stocks makes sense for a variety of reasons, especially diversification.
- 39% is the amount the top ten stocks in the S&P 500 comprise from a market capitalization perspective; the highest percentage on record (started reviewing in 1996).
- 55% of the S&P 500’s 2024 price-only return came from the Magnificent 7 stocks. Overall, these 7 stocks returned 48% vs. the S&P 500’s price-only return of 23%.
2024 is in the books. Bring on 2025…
- While we know Donald Trump won the 2024 election, there is still uncertainty related to his policies that will impact the economy and markets in 2025 and beyond.
- Some of these policy decisions may impact things like tariffs and inflation, and the results could then impact future Fed decisions.
Well, 2024 is in the books, and what a year it was. It was full of political and economic events, many of which were unexpected, just like every other year.
As we head into 2025, it is possible that by the time you read this, President Trump will have been inaugurated again. So, while we had election uncertainty for much of 2024, we are now moving into a period of policy uncertainty.
There are two main potential policies that can impact the economy that are causing the most concern among investors, especially as they relate to inflation. These are policies related to tariffs and immigration. Let’s keep in mind everything we have heard so far are POTENTIAL policies, and we don’t know what exactly will be enacted, when they could be enacted, or what the ramifications are. In short, there are lots of variables to consider here.
As it relates to immigration, policies related to limits on immigration or even mass deportation could be inflationary as there would be fewer workers, which could create higher wage costs, which could then be passed on to the consumer. However, a smaller labor force could pose risks to GDP growth, and we would imagine the people in President Trump’s camp are also considering this factor in his decision process. In addition, the costs of actually implementing mass deportations could be quite high and it’s not guaranteed those costs would be approved. The short story is that with any new president there is expected to be new policies. Once we have a clearer picture of what the policies will be, there will be a greater understanding related to potential economic impact.
The tariff story
Another potential President Trump policy relates to tariffs. But again, the actual policy matters as we don’t currently know whether the proposed tariffs will be 10%, 20%, or 60% as has been suggested for China. We also don’t know exactly which countries they will be enacted on, nor do we know how those countries will retaliate with tariffs of their own, which could hurt US exports. Overall, and depending on their size, tariffs can be inflationary, and they can also slow the US economy by lowering demand and investment, which is not good for the US economy. If both effects materialize, that is known as “stagflation,” an economist’s bogeyman.
We can look back to Trump’s first term for guidance on tariffs. While the tariff rate on US goods imports for consumption rose, it was only a marginal increase, and well below what it had been in previous decades. Looking back at 2017 and the first year of his first term, tariffs were a hot topic then too. From an investment standpoint, conventional wisdom suggested avoiding emerging market stocks (Chinese stocks comprise roughly 30% of emerging market stock indexes) because the thought was they would be negatively impacted by the tariffs. Wouldn’t you know it….emerging market stocks returned over 37% in 2017, making it the highest returning major market asset class for the year. As we have said many times before, timing the market is really hard to do….
The inflation story
Thinking ahead to President Trump’s second term, let’s put some inflationary numbers in perspective. We know the Fed targets 2% inflation. It’s instructive to look back at Trump’s first term, especially as tariffs, and their potential to increase inflation, were hot topics in 2017 too. At the same time, we should acknowledge that we are in a different economic environment now, so there should be no expectation that his second term will be like his first. For Trump’s first term, average year-over-year inflation from 2017-2021 was 1.9%. For reference, it was 2.6% under Obama from 2009-2017 and so far, has averaged about 5.2% under Biden since 2021, through November 2024).
Keeping things in perspective, it is important to remember that when we hear about policies being inflationary, we need to ask ourselves whether that means inflation at 3.5%, 5%, 9% or higher? The level of inflation absolutely matters.
The Fed’s delicate dance
The Fed continued to cut the Fed Funds rate by an additional 50 bps (25 bps in both their November and December meetings) during the 4th quarter, but what happens next? The Fed is currently penciling in two more decreases in 2025 (but remember how wrong estimates were for 2024). At the same time, Fed Chair Powell’s recent comments have been more upbeat, focusing on a strong economy and labor markets, with continued low unemployment and with the current policy uncertainty, this might discourage reducing rates. The Fed is keeping a wait-and-see approach regarding what policies are ultimately implemented under President Trump. What the Fed doesn’t want to do is to lower interest rates too much or too quickly, only to be in a position to raise rates if some of the new policies are indeed inflationary.
U.S. Stocks
- US stocks were mixed for Q4 but all were positive for the year.
- The S&P 500 returned 25.0% in 2024, marking its second consecutive year of 20% annual returns.
- The top ten stocks in the S&P 500 represent 39% of the index, indicating a high level of concentration, even well above the percentage during the internet bubble.
The S&P 500 returned 25.0% in 2024, marking its second consecutive year of 20% annual returns. This has only happened a few times in the past (going back to 1976). It first happened in 1982 (21.6%) and 1983 (22.56%) and remained positive for the following six consecutive years when the S&P earned an annualized return of a healthy 17.9%.
The next time it occurred was 1995-1999 (1995-37.6%, 1996-23.0%, 1997-33.4%, 1998-28.6%, 1999-21.0%) but this period was followed by 3 consecutive years of negative returns (-9.1%, -11.9%, -22.1%). In other words, we have no way of knowing what 2025 will bring and it reminds us very clearly that past performance is not indicative of future results.
What will happen in 2025 for stocks? We wish we had a crystal ball to tell you. And while we don’t have a crystal ball, there is no shortage of pundits making their predictions. Should you listen to them? History says no as forecasts have been shown to be quite wrong.
Exhibit 1
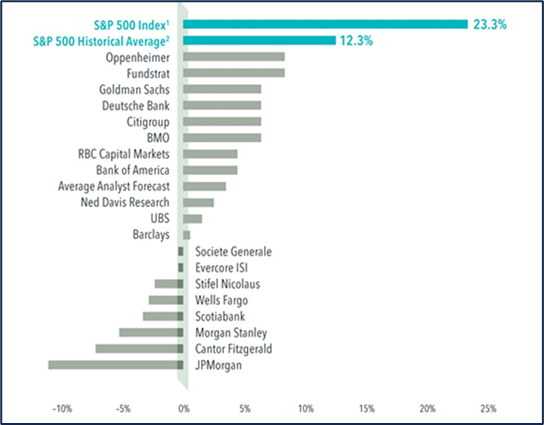
1 Price-only return, 2 Based on actual S&P 500 Index average total return from 1927-2024. Past performance is no guarantee of future results. In USD. Source: Dimensional Funds, Bloomberg, using the “Strategists S&P 500 Index Estimates for Year-End 2024” as of December 19, 2023. Analyst forecasts and 2024 returns are price-only returns. S&P Dow Jones Indices LLC, a division of S&P Global. All rights reserved. Indices are not available for direct investment; therefore, their performance does not reflect the expenses associated with the management of the actual portfolio.
Exhibit 1 shows some of the actual forecasts made for 2024 by some of the largest and well-known financial institutions. What do we see? Well, the actual results of the S&P 500 were much better than what every analyst forecasted. In fact, roughly half of the analysts predicted a negative outcome for the S&P 500.
In other words, while forecasting makes for interesting debate and conversation, we wouldn’t suggest basing your investment strategy off forecasts. Plus, how would you know which forecaster to follow?
US stocks are historically expensive
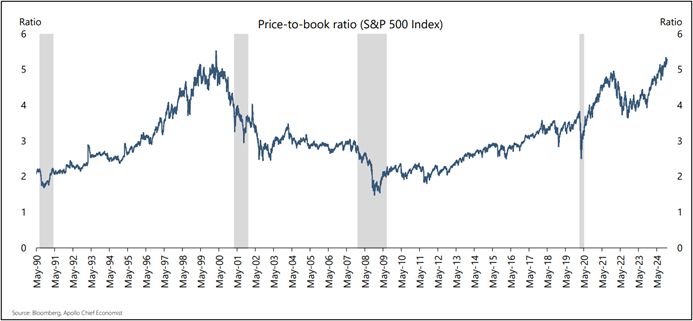
We all know US stocks have done really well over the last decade or so relative to non-US stocks. What could keep that momentum from continuing? One factor is that if you look at the price to book ratio (a measure of valuation) of the S&P 500 as shown in Exhibit 2, it is at record levels, highlighting another piece of evidence that US stocks are expensive at the moment. Valuations appear stretched almost regardless of which metric you favor. It is important to keep in mind that while US stocks are currently considered expensive, there is no way to know if or when their prices might decline, so we would not recommend trying to time movements in or out of these markets. That said, and if nothing else, we would caution against overconcentrating in that area of the market.
Exhibit 2
Non-U.s. Equity
- Developed and emerging non-US stock market returns were all negative for Q4, but all positive for 2024.
- Once again, currencies played an important role in the return of non-US stocks.
Exhibit 3
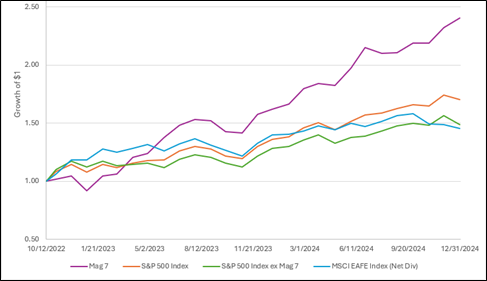
Source: Avantis. Performance from 10/12/2022-12/31/2024. This date in Oct 2022 is considered the start of the current bull market. The Magnificent 7 refers to stocks of Alphabet, Amazon, Apple, Meta, Microsoft, NVIDIA, and Tesla. Past performance is not indicative of future results.
Going back to US stock performance for a second, we all know how well the S&P 500 has performed over the last couple of years. We also know that a sizeable portion of that return has been driven by what is referred to as the Magnificent 7, or Mag 7 stocks. Looking at Exhibit 3, we can see that since 10/12/2022 (the start of the current bull market), international developed stocks have kept pace with the S&P 500 excluding the Mag 7 stocks. Looking forward, a potential positive aspect of holding non-US stocks is that their valuations are currently much more reasonable than US large cap stock valuations. And if you believe that current valuations are a precursor of future returns like we do, this means that non-US stocks have the potential to outpace US stocks in the coming years. Plus, if the US dollar were to decline from its current high levels, that would also be a tailwind for non-US stocks.
Once again, currencies played an important role in the return of non-US stocks. As an example, the 2024 return for international developed large cap stocks (MSCI World ex USA) was 4.7% in USD terms but 12.4% in local currency terms. Similarly, the 2024 return for emerging market stocks (MSCI EM) was 7.5% in USD terms but 13.1% in local currency terms. In other words, the companies outside the US are earning strong returns, but US investors aren’t necessarily experiencing those same returns due to a very strong US dollar.
Global REITs (Real Estate Investment Trusts)
- Global REITs, as represented by the Dow Jones Global Select REIT, fell by -8.2% over the quarter but rose by 3.3% over the last 12 months.
- In the US, specialty REITs performed the best YTD (35.9%). Source: NAREIT
Global Fixed Income
- Bond returns were mainly negative for the quarter, but all were positive for the year.
- The US Treasury yield curve saw significant movement throughout the year.
Exhibit 4
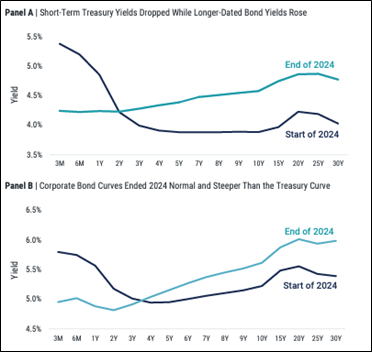
Source: Bloomberg, Avantis. Data as of 12/31/2023 and 12/31/2024
Exhibit 4 shows how both the US Treasury and corporate yield curves were inverted (short-term bond yields are higher than long-term yields) to start the year. During 2024, the Fed lowered short-term rates, and we can see the decline in both short-term Treasury and Corp rates from the beginning to the end of the year. However, the rest of the yield curve did not decline; yields actually rose.
Exhibit 5
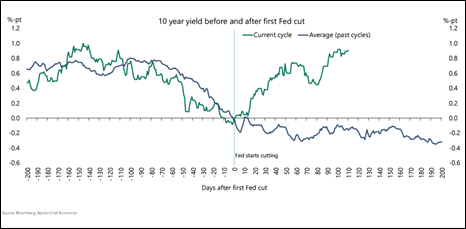
One factor possibly driving interest rates higher on the longer end of the curve is a lower risk of recession. If you think about it, if there is less risk of recession, there is less demand for the safety of Treasuries, so their prices go down (and yields move inversely with prices).
Another factor possibly impacting longer-term yields is the question as to whether some of President Trump’s proposed policies could be inflationary, as higher inflation could also drive longer-term yields higher.
Historically, having longer-term yields rise when the Fed is cutting short-term rates is not the norm, as Exhibit 5 shows.
Overall, we continue to view our bond allocations as a method of reducing overall portfolio risk (as measured by standard deviation), given that stocks are expected to have much higher volatility. Our portfolio’s focus will continue to be on high-quality bonds with an emphasis on short to intermediate-duration government and corporate bonds, where default risk has historically been relatively low.
Investment advisory services offered through Equita Financial Network, Inc. (“Equita”). Equita also markets investment advisory services under the name AegleWealth LLC. East Bay Investment Solutions and Equita Financial Network, Inc. have an arrangement whereby East Bay Investment Solutions, a Registered Investment Advisory firm, provides model recommendations on a consulting basis to Equita Financial Network, Inc. Equita Financial Network, Inc. maintains full discretion and trading authority over its clients’ accounts.
This document contains general information, may be based on authorities that are subject to change, and is not a substitute for professional advice or services. This document does not constitute tax, consulting, business, financial, investment, legal or other professional advice, and you should consult a qualified professional advisor before taking any action based on the information herein. This document is intended for the exclusive use of clients or prospective clients of Equita Financial Network, Inc. Content is privileged and confidential. Information has been obtained by a variety of sources believed to be reliable though not independently verified. To the extent capital markets assumptions or projections are used, actual returns, volatilities and correlations will differ from assumptions. Historical and forecasted information does not include advisory fees, transaction fees, custody fees, taxes or any other expenses associated with investable products. Actual expenses will detract from performance. Past performance does not indicate future performance.
The sole purpose of this document is to inform, and it is not intended to be an offer or solicitation to purchase or sell any security, or investment or service. Investments mentioned in this document may not be suitable for investors. Before making any investment, each investor should carefully consider the risks associated with the investment and make a determination based on the investor’s own particular circumstances, that the investment is consistent with the investor’s investment objectives. Information in this document was prepared by East Bay Investment Solutions and modified by Equita. Although information in this document has been obtained from sources believed to be reliable, East Bay Investment Solutions and Equita does not guarantee its accuracy, completeness or reliability and are not responsible or liable for any direct, indirect or consequential losses from its use. Any such information may be incomplete or condensed and is subject to change without notice.
Visit eastbayis.com or more information regarding East Bay Investment Solutions.
Investment Advisory services offered through Equita Financial Network, Inc., an Investment Adviser with the U.S. Securities and Exchange Commission. Equita Financial Network also markets investment advisory services under the name AegleWealth. The foregoing content reflects our opinions and is subject to change at any time without notice. Content provided herein is for informational purposes only and should not be used or construed as investment advice or a recommendation regarding the purchase or sale of any security. There is no guarantee that the statements, opinions, or forecasts provided herein will prove to be correct. All investing involves risk, including the potential for loss of principal. There is no guarantee that any investment plan or strategy will be successful. Along with the author’s views, the reflections above include contributions from Beyond AUM and ChatON AI.
