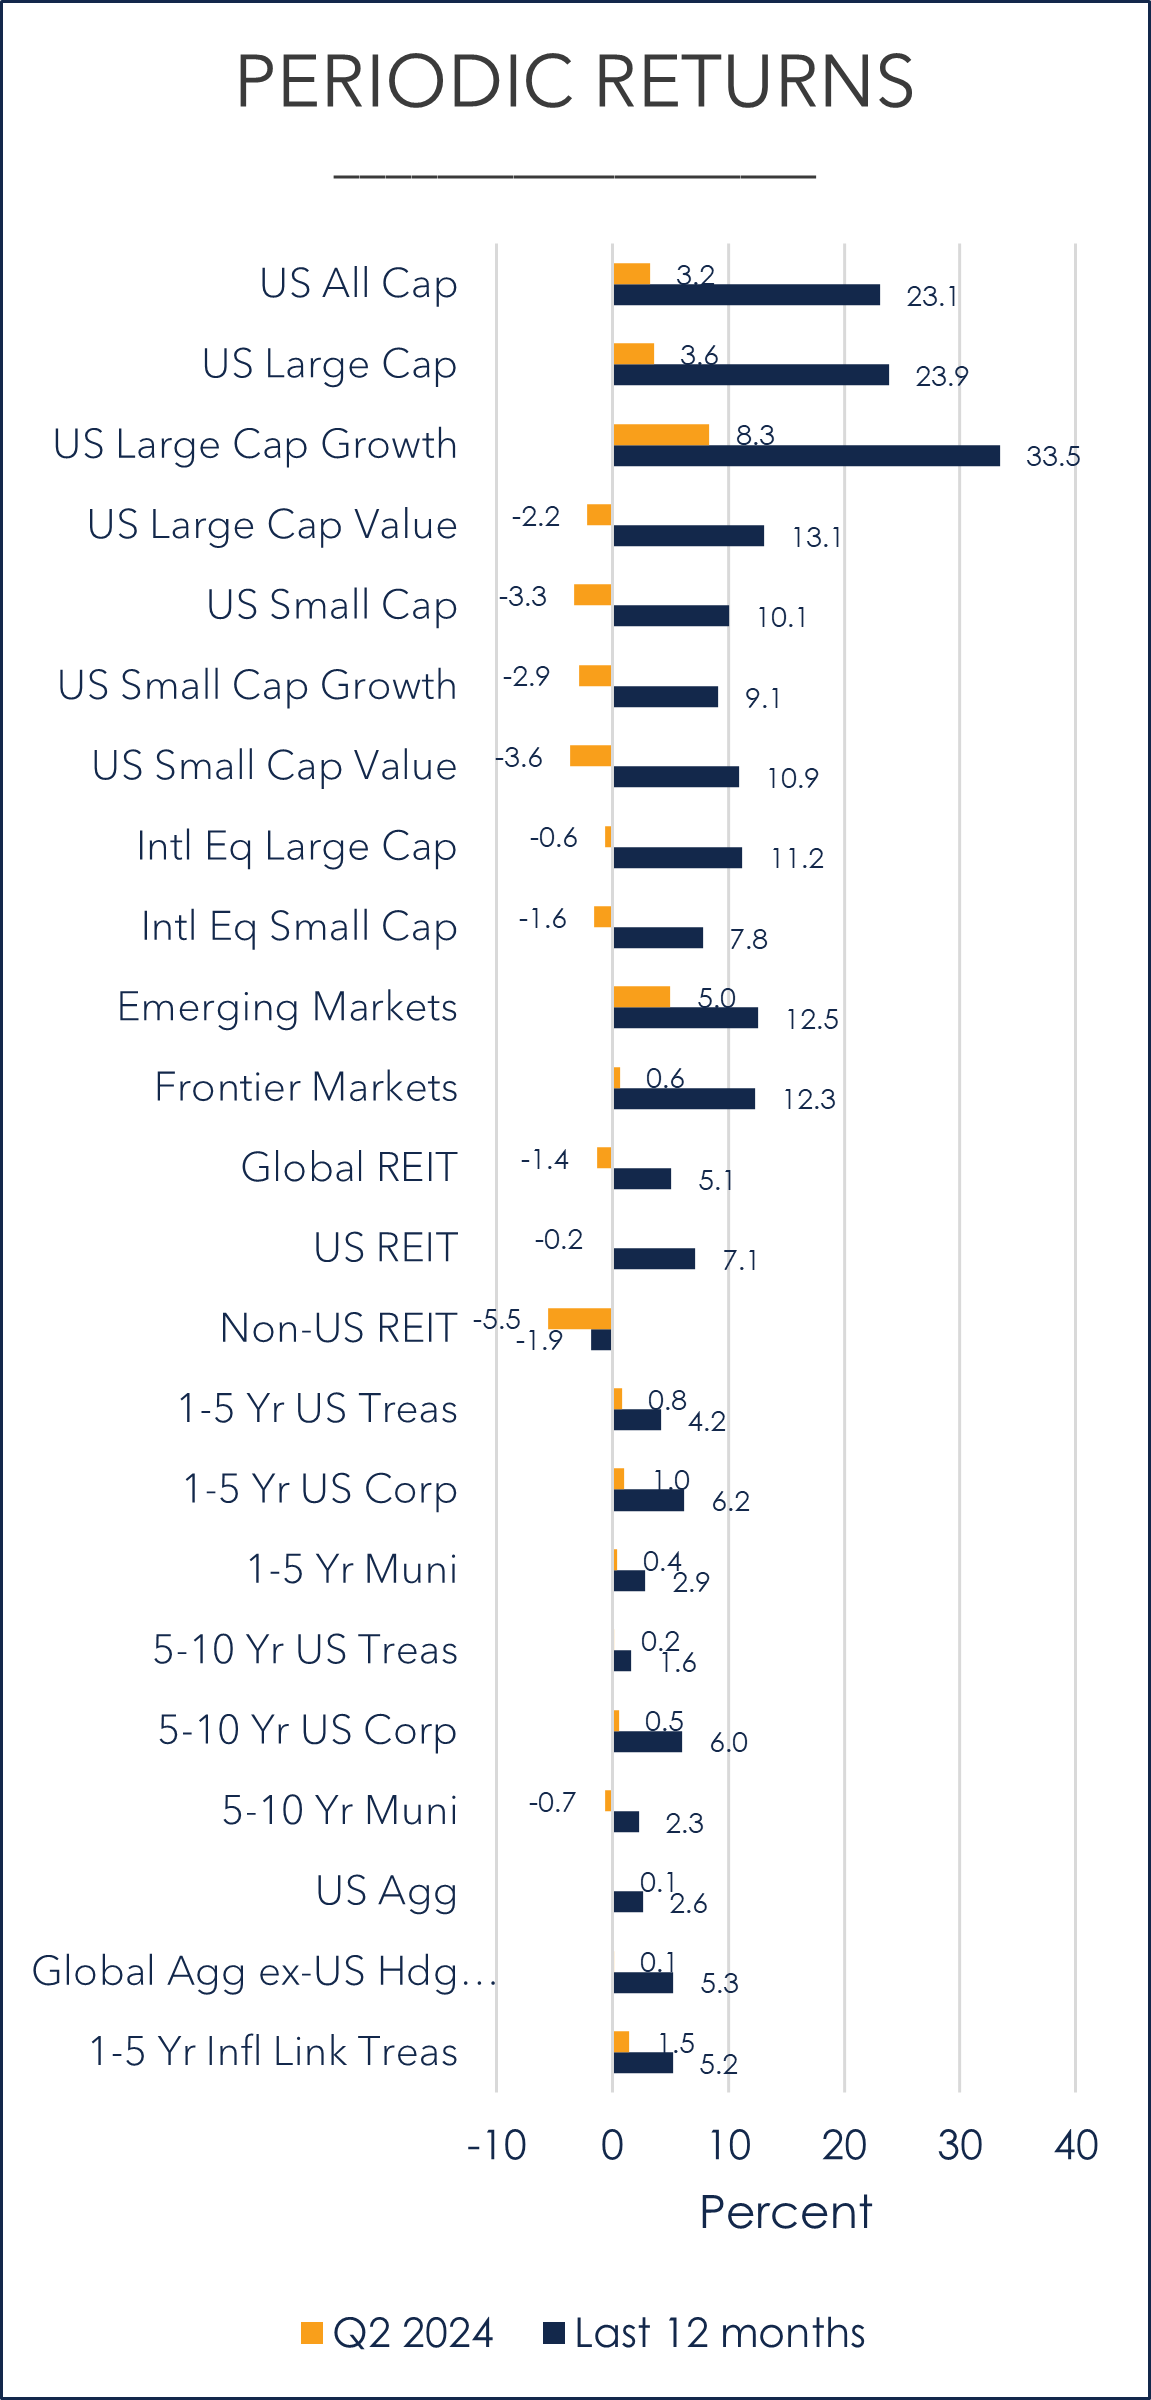
Source: Morningstar; Russel, MSCI, Dow Jones, Bloomberg, ICE BoA ML benchmarks shown; past performances is not indicative of future results.
Q2 2024 by the numbers
- 5.25% – 5.50% was the Fed’s policy rate set in July 2023 as they worked to tame inflation, the highest level since 2001. The Fed has paused here as investors await the pivot to lower rates.
- One interest rate cut is now expected by the Federal Reserve in 2024; six to seven cuts were initially expected as we started 2024; three cuts were anticipated just last quarter.
- 3.3% and 2.6% were the May 2024 headline CPI and PCE figures, slightly below the 3.4% and 2.7% April figures.
- 37% is the amount the top ten stocks in the S&P 500 comprise from a market capitalization perspective; a mark that is the highest it’s been going back to at least 1996, and well above the percentage set in the internet bubble.
- 4.3% was the S&P 500 return for Q2. 4.1% of it came from the information technology sector alone.
- 15.3% was the S&P 500 return YTD through June 30. Without just one stock, Nvidia, the S&P 500 return would have been around 11%.
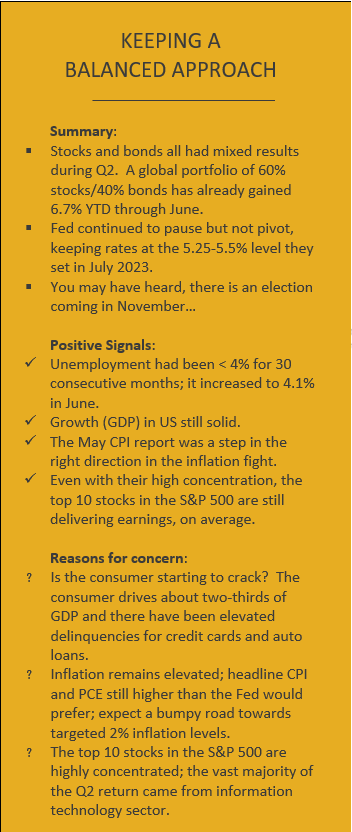
Let’s Talk About the Economy
- Economy remains strong, but cracks may be showing.
- Inflation is still higher than preferred
The overall economy remains in a relatively good position, though some cracks may be starting to appear. If we talk about economic growth, the most recent GDP numbers showed a year over year increase of 2.9%, which is above trend growth of 2%. At the same time, roughly two-thirds of GDP is driven by consumers, and we know there have been elevated delinquencies for credit cards and auto loans. At the same time, the jobs report that came out in early July showed contrasting data with the number of new jobs added slightly beating expectations while the unemployment rate eked up to 4.1%, breaking a string of 30 consecutive months it had been below 4%. This data is part of the backdrop for the Fed’s decision whether to lower the Fed Funds rate, especially as inflation remains elevated and above their 2% target.
One interesting aspect of inflation is where it has been coming from. In 2022, when CPI jumped to over 9%, inflation was coming from almost every underlying component. However, if we look at the contributors to inflation today, it is primarily coming from shelter, dining & recreation, and auto insurance, and not so much from energy and core goods like it had a couple of years ago.
Where we stand today, the Fed is expecting one rate cut in 2024, which pales in comparison to the six to seven that were expected at the start of the year, or even the three that were expected just last year.
Fed Chairman Powell continued to state the Fed is going to be data dependent in deciding if and when to lower rates. And as we approach November (you may have heard there are elections in November), some investors may ask if the Fed would make any rate cuts before the election? The simple answer is yes, they may, as they have in the past. Last quarter we showed a chart highlighting the path of Fed rate cuts and increases, along with how they intersected with election years. This quarter we are giving you the data. As Exhibit 1 shows, the Fed has adjusted rates by 25 bps nearly six times, on average, during election years, similar to what it has been during inauguration years, and slightly higher vs. non-election years, highlighting the Fed remaining apolitical.
Exhibit 1
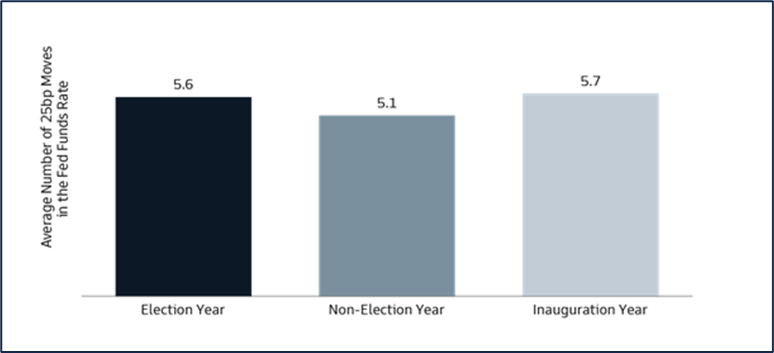
Source: St. Louis Fed and Goldman Sachs Asset Management, as of June 28, 2024
U.S. Stocks
- US stock indexes were mixed for the second quarter, though most are positive YTD.
- The tech sector dominated S&P 500 returns in Q2.
- The top ten stocks in the S&P 500 represent 37% of the index, indicating a high level of concentration, even well above the percentage during the internet bubble.
In the US, the S&P returned 4.3% for the second quarter, with the tech sector being responsible for 4.1% of the return (95%). In fact, as Exhibit 2 shows, tech was the only sector that contributed more than 1% to return, with six of the 11 sectors having negative returns for the quarter.
Exhibit 2
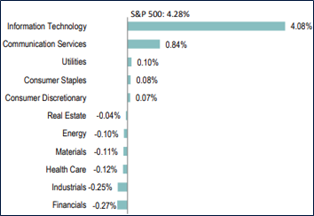
Source: https://www.spglobal.com/spdji/en/documents/performance-reports/dashboard-us.pdf. Past performance is not indicative of future results.
We also know from Exhibit 3 that YTD through June, a majority of the S&P 500’s 15.3% return (61%) came from just seven stocks, known as the Magnificent 7, as they have returned 33% YTD while the rest of the S&P returned only 5%.
Exhibit 3
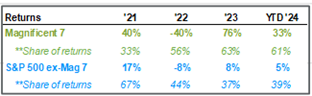
Source: Factset, Standard and Poors, JP Morgan Asset Management. Past performance is not indicative of future results.
Based on the success of the Mag 7 in 2023 and 2024, some investors may be tempted to significantly overweight those stocks, thinking they will continue to dominate.
However, if history is our guide, Exhibit 4 shows that since 1990, on average, four of the top 10 S&P stocks by market capitalization fell out of the group in the following five years, on average. In other words, we would recommend diversifying into other stocks as well.
Exhibit 4
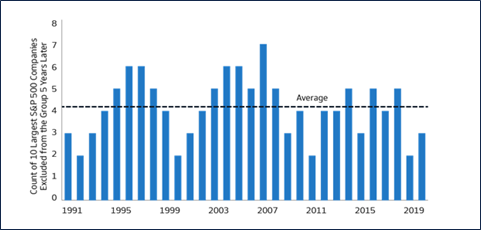
Source: Bloomberg and Goldman Sachs Asset Management. As of March 31, 2024. Past performance is not indicative of future results.
In fact, if you look at the top 10 holdings in the S&P 500 from five years ago vs. today, there are three stocks that were in the top 10 (Johnson and Johnson, JP Morgan, and Exxon Mobil) that are no longer included and were replaced by Nvidia, Eli Lilly, and Broadcom.
And if you go back 10 years to July 1, 2014, only three of the S&P 500 holdings from that time (Microsoft, Apple, and Berkshire Hathaway) are still in the top 10 now. The other seven stocks that were previously included (Exxon Mobil, Johnson and Johnson, GE, Wells Fargo, Chevron, JP Morgan, and Proctor & Gamble) have all fallen out.
Note: The review of holdings from five and ten years ago was done using Morningstar Direct, using SPY as the ticker as that was a S&P ETF with recent holdings available (June 27, 2024)
Non-U.S. Equity
- Developed non-US stock returns were all negative for Q2, while emerging markets gained 5.0%.
- Developed and emerging market stocks are all positive YTD through June.
- There are many strong-performing stocks outside the US.
Some investors look at the returns generated in the US and suggest that non-US companies simply can’t keep pace. However, this doesn’t appear to be the case as we dove into the question to whether the US has a monopoly on the best performing stocks across the globe. We used the ticker ACWI for this analysis, an ETF that represents the global stock market. What we found is the US has 11 of the top 50 performing stocks across the globe, meaning the 39 other stocks come from outside the US. Specifically, 11 more of the top 50 came from India, nine from China, seven from South Korea, with Japan, Taiwan, Malaysia, Belgium, Germany, Norway, and Singapore all being represented in the top 50.
We also wanted to answer the question as to whether the tech sector has a monopoly on the best performing stocks across the globe. Again, the answer was no. As Exhibit 5 shows, while 13 of the top 50 performing global stocks were in the tech sector, there were 15 in the industrial sector. There were another six each in consumer cyclicals and utilities.
Exhibit 5
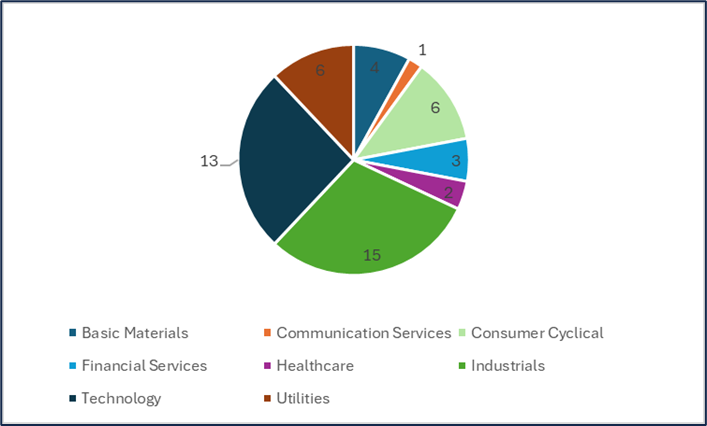
Source: Morningstar Direct, ACWI was the ETF used to replicate the MSCI ACWI, data as of June 13, 2024. Past performance is not indicative of future results.
Global REITs (RealEstate Investment Trusts)
- Global REITs, as represented by the Dow Jones Global Select REIT, declined 1.4% over the quarter and are down -3.0% YTD through June.
- In the US, specialty REITs performed the best YTD (18.9%). Source: NAREIT
Global Fixed Income
- Bond returns were mainly positive for the second quarter, with the exception of 5-10 year munis, even as Treasury yields mostly rose.
- While current cash and money market rates are attractive, bonds have historically generated much stronger returns following CD’s hitting their peak rates (which is assumed to have happened September 30, 2023). Don’t get caught sitting in cash and missing out on bond returns.
Treasury rates rose slightly across most of the US Treasury curve over the quarter, and the yield curve is slightly less inverted than it was three months ago. The same can be said for the corporate and municipal yield curves as well.
As of June 30, the yield to maturity on corporate bonds rated A-BBB was 5.61%. This is an attractive yield, especially given their relatively low credit risk.
There are many rules of thumb in investing. Unfortunately, like other rules of thumb, many are based on perceived experiences rather than theory or reality, and therefore can be invalid. One rule of thumb we often hear is that an inverted yield curve is a sign that a recession is likely coming. As a reminder, an inverted yield curve is when short term interest rates are higher vs. long term rates and is considered unusual as investors should expect a higher level of return for longer-dated bond instruments.
Is this rule of thumb accurate? Well, Exhibit 6 shows several periods where there have been lengthy periods between a yield curve inversion and the next recession. Note in the bottom row that, not only has the predicted recession not occurred, but the equity market has been positive during this period as well, returning 12.9% through April 30, 2024.
Exhibit 6
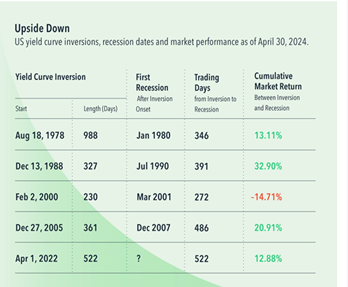
Source: Source: Dimensional Funds, Past performance is not a guarantee of future results. Actual returns may be lower. Inversion when the yield on the 2-year Treasury exceeded the yield on the 10-year Treasury. Recession dates represent the peak month of the business cycle. Individual inversion onset defined as those lasting at least 50 trading days with no inversion in the prior 250 trading days. Number of days and return since onset of current inversion are through April 30, 2024. 10-year and 2-year constant maturity Treasury yields from FactSet. Business cycle dates from NBER. Market return represented by the Fama/French Total US Market Research Index. The Fama/French indices represent academic concepts that may be used in portfolio construction and are not available for direct investment or for use as a benchmark. Eugene Fama and Ken French are members of the Board of Directors of the general partner of, and provide consulting services to, Dimensional Fund Advisors LP. See “Index Descriptions” for descriptions of the Fama/French index data.
This debunks yet another misconception that stock market returns are correlated with economic growth. This data provides all the more reason we would not recommend investing simply based on rules of thumb.
Overall, we continue to view our bond allocations as a method of reducing overall portfolio risk (as measured by standard deviation), given that stocks are expected to have much higher volatility. Our portfolio’s focus will continue to be on high quality bonds with an emphasis on short to intermediate duration government and corporate bonds, where default risk has historically been relatively low.
Investment advisory services offered through Equita Financial Network, Inc. (“Equita”). Equita also markets investment advisory services under the name AegleWealth LLC. East Bay Investment Solutions and Equita Financial Network, Inc. have an arrangement whereby East Bay Investment Solutions, a Registered Investment Advisory firm, provides model recommendations on a consulting basis to Equita Financial Network, Inc. Equita Financial Network, Inc. maintains full discretion and trading authority over its clients’ accounts.
This document contains general information, may be based on authorities that are subject to change, and is not a substitute for professional advice or services. This document does not constitute tax, consulting, business, financial, investment, legal or other professional advice, and you should consult a qualified professional advisor before taking any action based on the information herein. This document is intended for the exclusive use of clients or prospective clients of Equita Financial Network, Inc. Content is privileged and confidential. Information has been obtained by a variety of sources believed to be reliable though not independently verified. To the extent capital markets assumptions or projections are used, actual returns, volatilities and correlations will differ from assumptions. Historical and forecasted information does not include advisory fees, transaction fees, custody fees, taxes or any other expenses associated with investable products. Actual expenses will detract from performance. Past performance does not indicate future performance.
The sole purpose of this document is to inform, and it is not intended to be an offer or solicitation to purchase or sell any security, or investment or service. Investments mentioned in this document may not be suitable for investors. Before making any investment, each investor should carefully consider the risks associated with the investment and make a determination based on the investor’s own particular circumstances, that the investment is consistent with the investor’s investment objectives. Information in this document was prepared by East Bay Investment Solutions and modified by Equita. Although information in this document has been obtained from sources believed to be reliable, East Bay Investment Solutions and Equita does not guarantee its accuracy, completeness or reliability and are not responsible or liable for any direct, indirect or consequential losses from its use. Any such information may be incomplete or condensed and is subject to change without notice.
Visit eastbayis.com or more information regarding East Bay Investment Solutions.
Investment Advisory services offered through Equita Financial Network, Inc., an Investment Adviser with the U.S. Securities and Exchange Commission. Equita Financial Network also markets investment advisory services under the name AegleWealth. The foregoing content reflects our opinions and is subject to change at any time without notice. Content provided herein is for informational purposes only and should not be used or construed as investment advice or a recommendation regarding the purchase or sale of any security. There is no guarantee that the statements, opinions, or forecasts provided herein will prove to be correct. All investing involves risk, including the potential for loss of principal. There is no guarantee that any investment plan or strategy will be successful. Along with the author’s views, the reflections above include contributions from Beyond AUM and ChatON AI.