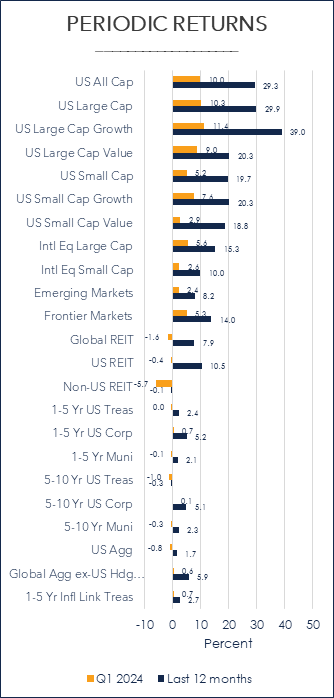
Source: Morningstar; Russel, MSCI, Dow Jones, Bloomberg, ICE BoA ML benchmarks shown; past performances is not indicative of future results.
Q1 2024 by the numbers
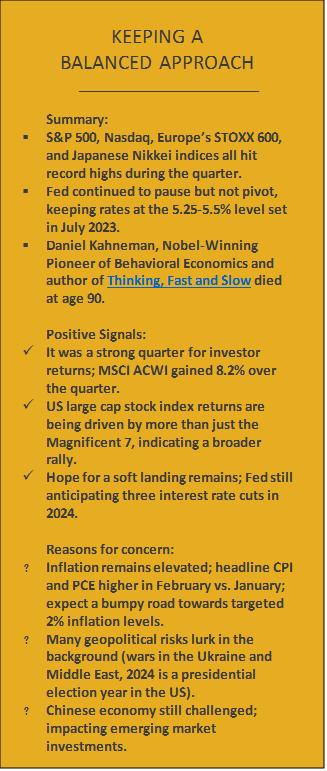
- 5.25% – 5.50% was the Fed’s policy rate set in July 2023 as they worked to tame inflation, the highest level since 2001. The Fed has paused here as investors await the pivot to lower rates.
- 3 interest rate cuts now expected by the Federal Reserve in 2024; 6 to 7 cuts were expected at the start of 2024.
- 8.2% was the quarterly return for global stocks (MSCI ACWI), highlighting a very strong start to the year.
- The Japanese Nikkei index reached a new high 34 years after setting its previous high.
- 3.2% and 2.5% were the February 2024 headline CPI and PCE figures, slightly above the 3.1% and 2.4% January figures.
- 5.49% was where the 1-month Treasury closed in March 2024, certainly an attractive yield and higher versus longer term yields. However, reinvestment risk exists if Fed Funds rates start to decline later in the year.
An update on US inflation and the Fed
For at least the last year we have spoken about the three P’s of Federal Reserve interest rate policy: pace, pause, and pivot. The Fed continues to pause, trying to strike a balance between a resilient economy and sticky inflation, not signaling any rate reductions until they are comfortable that inflation has met their targeted 2% level.
The Fed says they will continue to be data dependent on making any future changes as inflation is still higher than desired, and with a labor market that remains tight. While many economists still expect inflation to eventually hit 2%, it is also expected to be a bumpy ride.
Interestingly, 2024 is an election year, and some investors may ask if the Fed would make any rate cuts before the election. First, it is important to remember that while the Federal Reserve Chairman is nominated by the US President, the Federal Reserve is not part of the Federal Government and is not directed to act based on the President’s wishes. In other words, they are expected to remain independent of politics. In addition, history shows us that since 1984, the Fed has indeed made changes to the Fed Funds rate during almost every election cycle.
Don’t let your political views drive your investments
We understand that regardless of which party you affiliate with, it is possible you have very strong opinions against the other party. However, we would suggest not changing your investment views based on who is in office. In the past, we have shown how the US stock market has consistently increased over time, regardless of which party is in the White House or which party controls Congress.
Exhibit 1
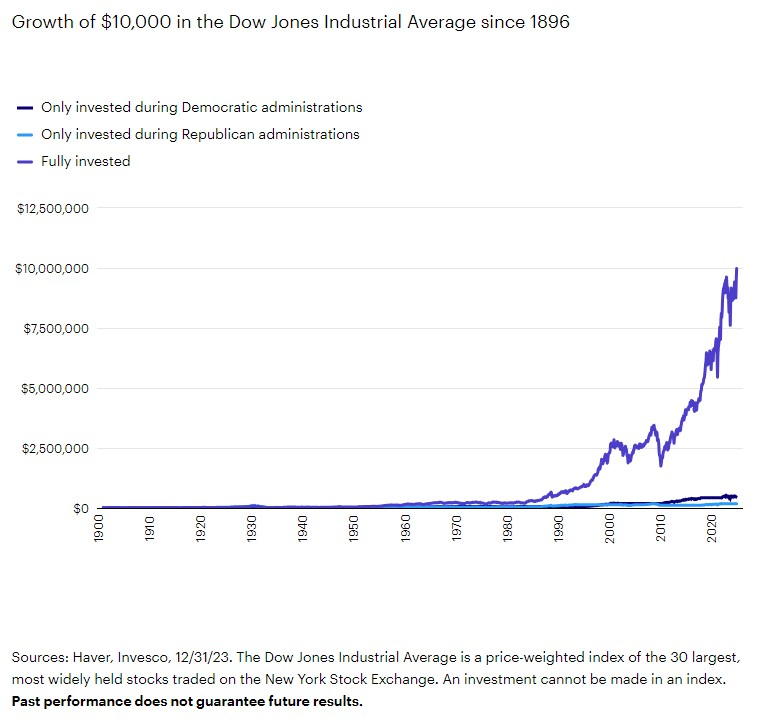
We wanted to take a little different approach with Exhibit 1, showing exactly what you would miss by investing when only one party is in the White House. The lines at the bottom of the graph that barely move off the x-axis show how much an investor would have received, going back to 1896, if an investor only invested when there was a Republican or a Democrat in office. Two things stick out: 1) the increase in the original $10K investment is not massive, and 2) they are fairly similar. However, when you compare that output vs. the other line which represents your $10K investment if you had simply stayed invested, you can see how that would have grown to roughly $10M.
And while Exhibit 1 shows us how staying invested has worked out over time, we also know there will be down markets, and as Exhibit 2 shows, those down markets will occur regardless of whether a Republican or Democrat is in the White House. In other words, stay invested, don’t let politics drive your investments, and let the power of compounding do its thing.
Exhibit 2
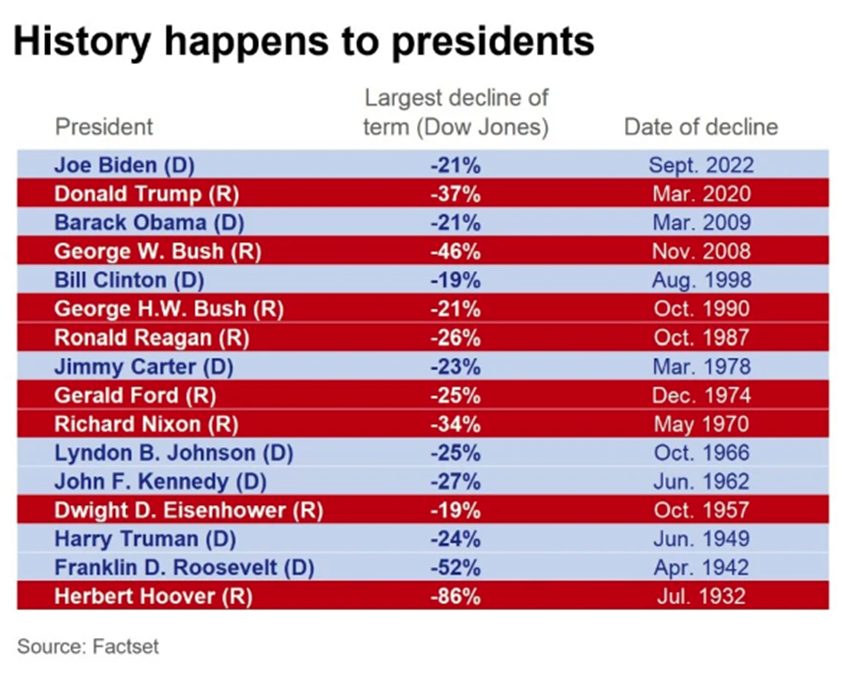
Source: Factset
U.S. Stocks
- All US stock indexes we track had strong gains for the quarter and the last 12 months.
- The Magnificent 7 have been good this year, but not magnificent.
While several of the stocks in the Magnificent 7 have continued to do well during Q1 2024 (e.g Nvidia: +82.5%, Meta: +37.3%, Microsoft: +12.1%), some of the other stocks in that group have not performed as well (e.g. Tesla: -29.3%, Apple:-10.8%).
Separately, in reviewing small cap stocks in the US via the Russell 2000, the most common benchmark for US small cap stocks, note that just over 40% of its holdings are considered unprofitable. Why does this matter? It matters because studies have shown that more profitable companies tend to outperform less profitable companies, which makes intuitive sense. It is also why we prefer to recommend investments that focus on more profitable small cap companies.
Non-U.S. Equity
- Like US stocks, non-US stock returns were quite strong in Q1 and for the last 12 months.
- A stronger US Dollar has negatively impacted the return of international developed and emerging market stocks.
Some investors may look at international developed and emerging markets stock returns compared to their US counterparts and simply suggest that non-US companies simply can’t keep pace. However, there is more to the story than just the headline returns. Specifically, if you look at the MSCI World ex-USA in local currency, its Q1 return was 9.6%, very similar to the 10.3 return for the Russell 1000. However, because of a rising US Dollar relative to a basket of other currencies, the MSCI World ex-USA returned just 5.6% in USD terms.
Exhibit 3
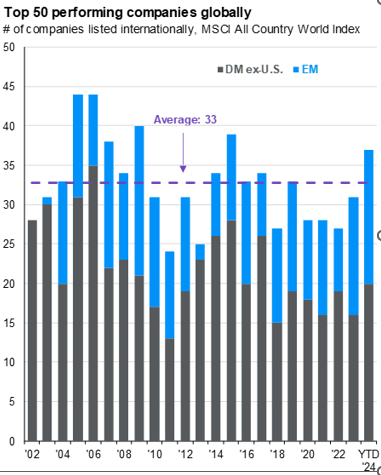
Source: FactSet, MSCI, J.P. Morgan Asset Management. Graph was made by ranking all the companies in the MSCI All Country World Index by performance on a yearly basis and determining the top 50 performers using their total return in USD. Companies are listed in no particular order. Excluded companies whose market capitalization does not make up at least 0.01% of the MSCI All Country World Index in the year listed. Guide to the Markets – U.S. Data are as of March 31, 2024.
Can non-US stocks keep pace with their US counterparts? Exhibit 3 says yes. The chart clearly shows that, on average, more than half of the top 50 performing companies on an annual basis tend to be listed outside the US.
Global REITs (Real Estate Investment Trusts)
- After a very strong Q4 2023, Global REITs declined -1.6% during Q1 2024.
- In the US, the sectors that performed the best over the quarter were specialty REITs (11.5%) and lodging/resorts (5.6%). Source: NAREIT
Global Fixed Income
- With the Fed holding rates higher for longer, yields rose across Treasury, corporate, and municipal bond yield curves.
- Global bonds ex-US (hedged USD) continued in the positive territory with gains of 0.6%.
Exhibit 4 shows that the Treasury yield curve is still inverted, meaning shorter term bonds are yielding more vs. longer term bonds, which is opposite of what should occur under “normal” conditions. Yields rose slightly as investors changed their expectations about possible Fed plans, with investors now expecting decreases coming towards the second half of the year, when they were previously anticipated to start earlier in the year.
Exhibit 4
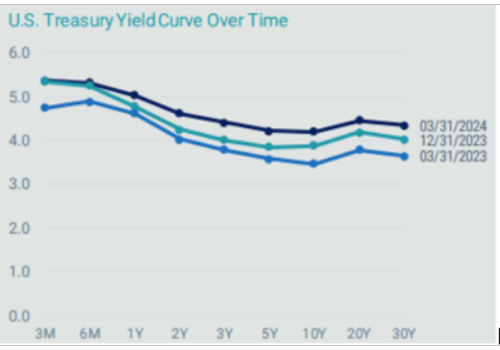
Source: Bloomberg, Avantis Investors, data as of 3/31/2024
Overall, we continue to view our bond allocations as a means of reducing overall portfolio risk (as measured by standard deviation), given that stocks are expected to have much higher volatility. Our portfolio’s focus will continue to be on high quality bonds with an emphasis on short to intermediate duration government and corporate bonds, where default risk has historically been relatively low.
Investment advisory services offered through Equita Financial Network, Inc. (“Equita”). Equita also markets investment advisory services under the name AegleWealth LLC. East Bay Investment Solutions and Equita Financial Network, Inc. have an arrangement whereby East Bay Investment Solutions, a Registered Investment Advisory firm, provides model recommendations on a consulting basis to Equita Financial Network, Inc. Equita Financial Network, Inc. maintains full discretion and trading authority over its clients’ accounts.
This document contains general information, may be based on authorities that are subject to change, and is not a substitute for professional advice or services. This document does not constitute tax, consulting, business, financial, investment, legal or other professional advice, and you should consult a qualified professional advisor before taking any action based on the information herein. This document is intended for the exclusive use of clients or prospective clients of Equita Financial Network, Inc. Content is privileged and confidential. Information has been obtained by a variety of sources believed to be reliable though not independently verified. To the extent capital markets assumptions or projections are used, actual returns, volatilities and correlations will differ from assumptions. Historical and forecasted information does not include advisory fees, transaction fees, custody fees, taxes or any other expenses associated with investable products. Actual expenses will detract from performance. Past performance does not indicate future performance.
The sole purpose of this document is to inform, and it is not intended to be an offer or solicitation to purchase or sell any security, or investment or service. Investments mentioned in this document may not be suitable for investors. Before making any investment, each investor should carefully consider the risks associated with the investment and make a determination based on the investor’s own particular circumstances, that the investment is consistent with the investor’s investment objectives. Information in this document was prepared by East Bay Investment Solutions and modified by Equita. Although information in this document has been obtained from sources believed to be reliable, East Bay Investment Solutions and Equita does not guarantee its accuracy, completeness or reliability and are not responsible or liable for any direct, indirect or consequential losses from its use. Any such information may be incomplete or condensed and is subject to change without notice.
Visit eastbayis.com or more information regarding East Bay Investment Solutions.
Investment Advisory services offered through Equita Financial Network, Inc., an Investment Adviser with the U.S. Securities and Exchange Commission. Equita Financial Network also markets investment advisory services under the name AegleWealth. The foregoing content reflects our opinions and is subject to change at any time without notice. Content provided herein is for informational purposes only and should not be used or construed as investment advice or a recommendation regarding the purchase or sale of any security. There is no guarantee that the statements, opinions, or forecasts provided herein will prove to be correct. All investing involves risk, including the potential for loss of principal. There is no guarantee that any investment plan or strategy will be successful. Along with the author’s views, the reflections above include contributions from Beyond AUM and ChatON AI.