Source: Morningstar; Russell, MSCI, Dow Jones, Bloomberg benchmarks shown; past performance is not indicative of future results

Q1 2026 by the numbers
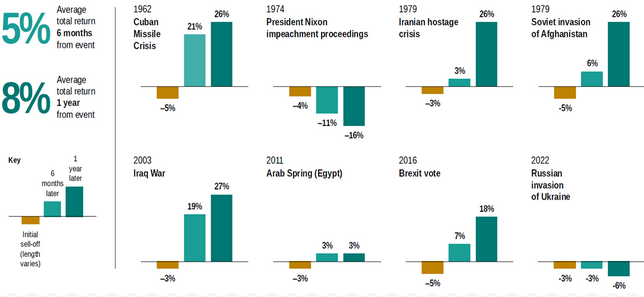
- 8% is the average one-year total return for the U.S. stock market following the onset of geopolitical events. Investors who choose to “do something” by selling stocks in response to such events tend to miss out on the market’s recovery and future growth.
- 20% represents the amount of the world’s oil supply that passes through the Strait of Hormuz, which is a critical shipping lane that was effectively closed during the war in Iran. Oil prices surged in Q1 as a result, but the price of oil and its long-term effect on stock market returns have not shown a strong causal relationship historically.
- 8 is the number of well-known, large, tech-related companies that underperformed the S&P 500 index in Q1. The collection of stocks widely known as the “Magnificent 7” welcomed a new member to the group now known by some as the “Hateful 8.”
- -1.9% is the YTD return of a portfolio comprised of 60% MSCI ACWI and 40% Bloomberg Global Aggregate (hedged USD). In other words, despite the unnerving headlines during the year and increased market volatility, a globally balanced portfolio comprised of both stocks and bonds is down just slightly this year.
A wave of economic headlines
- Inflation-adjusted U.S. GDP growth has slowed to 0.5% for the final reading for Q4.
- The Fed remains in “wait-and-see” mode.
So far this year, the U.S. economy continues to show resilience in the face of fresh uncertainty resulting from the war in Iran among other factors. Economic growth as measured by inflation-adjusted gross domestic product, a gauge of how many goods and services produced domestically, continues to show positive readings albeit at a slower rate than last year. At the same time, inflation and unemployment continue to remain in check, which gives the Federal Reserve more time to assess future economic trends before making future decisions on the Federal Funds rate and reinforces Fed Chairman Jerome Powell’s “wait-and-see” strategy. Nonetheless, the Fed’s preferred measure for inflation, the Core Personal Expenditures index, remains elevated at 3.0% and above the long-term 2.0% target. All of these data points and trends together mean that the Fed still finds itself walking a tight rope in trying to manage inflation without stifling economic growth to the point where unemployment begins to rise.
Exhibit 1
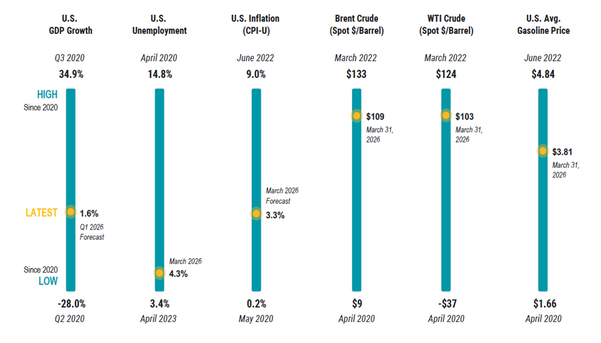
Unemployment Source: U.S. Bureau of Labor Statistics (BLS). U.S. Inflation Source: U.S. Bureau of Labor Statistics (BLS) and the Federal Reserve Bank of
Cleveland’s Inflation Nowcasting. Brent Crude, WTI Crude, and U.S. Average Gasoline Price Source: U.S. Energy Information Administration (EIA).
As shown in Exhibit 1, investors have been faced with a constant wave of economic headlines and data points since 2020. While the range for each data point listed in the exhibit has ranged widely during the last five years, the most recent reading (gold dot) for each of the data points show that each economic indicator rests within range during this time. And more importantly, these economic indicators and the economy at large are showing what has already happened while stock and bond markets look at what is likely to happen in the future. Said differently, economic indicators represent a point in time whereas investment markets are a look into the future. Markets take what is known today along with assumptions for what might happen in the future and set prices accordingly. As new information becomes available, markets rapidly adjust prices today. Therefore, if you are looking to make portfolio decisions based on today’s economic indicators, markets are already at least one step ahead of you.
Conflict can cause uncertainty
Perhaps the most pronounced theme in Q1 was the war in Iran, which provided a fresh dose of uncertainty for stock markets, which tend not to like uncertainty and were down on average for the quarter. Therefore, it’s useful to take a look at how markets have fared through prior geopolitical conflict and highlight that the strong urge to “do something” as investors in response to such conflict tends not to be rewarded over the long term. Exhibit 2 shows returns of the S&P 500 index at the start of some very notable geopolitical conflicts dating back to the 1960s. This is not an exhaustive list by any means, and each event took place during a differing macroeconomic backdrop. For example, in 2022 when Russia invaded Ukraine, the initial selloff as measured by the gold bar and the subsequent six- to 12-month returns were also influenced by a period of rapidly rising interest rates and inflation meaning that the invasion itself was not the only thing influencing markets at the time. In general, these selloffs are usually driven by investor uncertainty regarding how severe or prolonged the conflict might be rather than true economic fundamentals for the companies that makeup the S&P 500 or any other index. Importantly, markets are forward looking, and as more information becomes available, the range of possible outcomes narrows, and markets begin to stabilize. We can see this evidence on the left-hand side of Exhibit 2 as we look at the positive overall growth of markets in the 6 and 12-month periods following most of the events listed. If investors were to have decreased their allocations to stocks at the beginning of such conflicts waiting for uncertainty to subside, they would have likely missed out on the market recovery and future growth.
Exhibit 2
Oil price changes and stock market returns
Oil and energy prices are front-and-center in today’s war in Iran with the price of oil increasing substantially during the quarter as the Strait of Hormuz, a critical shipping lane responsible for the movement of 20% of the world’s oil supply, has been effectively closed so far during the conflict. This may have tempted some investors to want to buy oil and energy-related companies who might be expected to profit more from an increase in the price of commodities that they help produce, transport, and sell. To invesitigage this potential relationship, Dimensional Fund Advisors performed an analysis that looked at changes in crude oil prices for each calendar year dating back to 1964 and compared them to the stock returns of companies in the energy sector. Perhaps surpisingly, the idea that higher oil prices means more profits for energy producing companies (and more returns for their shareholders) does not seem to hold up historically. For example, when the price of oil increased by more than 150% in 1974, the energy sector of the stock market fell more than 20%. And even though oil prices dropped in 2025, the energy sector of the stock market was up. Taking this one step further, if oil prices are a poor predictor of energy company stock returns, it’s unlikely that changes in oil prices are any better at predicting movements in the broader stock market. Once more, investors are best served by sticking to their long-term plan through periods of uncertainty. As an aside, the U.S. economy has morphed over the years from an oil net-importer to an oil net-exporter, meaning that the country tends to produce and sell more oil abroad than it buys. This potentially mutes the negative economic effects of any dramatic increase in oil prices globally that the U.S. might otherwise sustain.
U.S. Equity
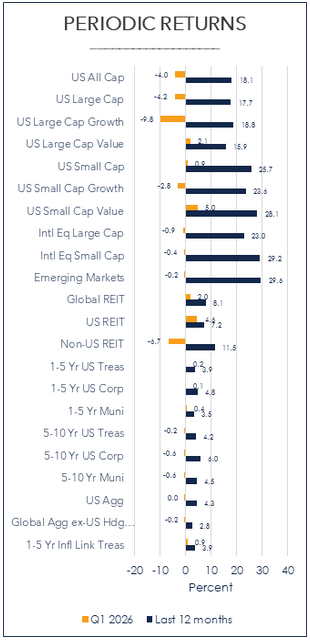
- U.S. stocks were negative for Q1 losing 4.0% but were supported by value stocks. Small-cap value stocks gained the most at 5.0%.
- Large-cap growth stocks weighed on the U.S. stock market during Q1 losing 9.8% fueled by losses in large, tech-related companies.
- Despite negative performance during the quarter, all U.S. stock asset classes were positive for the last 12 months with small-cap value stocks returning the most at 28.1%.
Uncertainty in today’s markets stretches beyond geopolitical conflict and oil prices. Dating back to late last year, artificial intelligence companies have come under the market’s broader scrutiny, namely the Magnificent 7, a group of high-flying tech stocks that has been represented by Microsoft, Tesla, Meta, Amazon, Apple, Google (Alphabet), and Nvidia. However, the group has garnered a new, catchy nickname—albeit less flattering—and has welcomed a new member company, Oracle, to the group now referred to by some as the “Hateful 8.” The trend that began in Q4 2025 where five of the seven companies underperformed the S&P 500 index has continued into 2026 and worsened with all of the Hateful 8 companies losing value this year with Microsoft and newcomer, Oracle, each losing more than 20% this quarter. For context, the S&P 500 lost 4.3% in Q1, of which Microsoft was responsible for about one quarter of the index’s overall loss. This highlights the importance of diversification in investor portfolios and to not take undue company-specific or sector risks.
Non-U.S. Equity
- Broad developed and emerging non-US stock market returns were negative for Q1 although outpaced the U.S. stock market.
- International developed large-cap value stocks were the leading stock asset class outside of the U.S. in Q1 returning 2.5%.
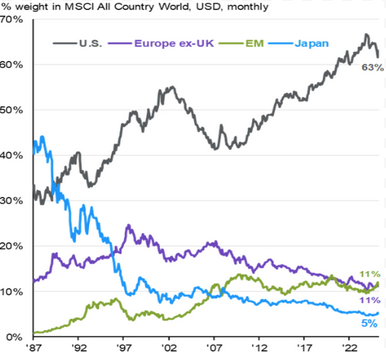
Outside of the U.S. stock market, international developed and emerging stock markets each bested the U.S. market in 2025 by wide margins. So far this year, their margins of success over the U.S. market haven’t been as dramatic but intact nonetheless and made all the more impressive with the Iran war as the backdrop. If these geographic performance trends begin to build further over the coming quarters and years, this impacts the makeup of the global stock market. We can see this dynamic playing out in Exhibit 3, which represents the global stock market share for select countries and regions. First, in looking at the U.S. share of the global stock market (i.e., it’s overall value relative to other regions), we see that the U.S. has had and continues to enjoy the top spot in terms of size of collective stock market wealth relative to the rest of the world for some time now. But that wasn’t always the case. Japan as recently as the early 1990s represented the bulk of the world’s stock market wealth. However, investors who were certain that Japan would continue to be the dominant driver of global market returns were sure to be disappointed over the next few decades as country market performance waned and other countries and regions accelerated. Relating this historical trend to today, it’s important to keep geographic diversification in mind when investing. While we have no way of knowing what country or region will go on to outperform over the next few decades, having exposure to the global market will ensure that investors can benefit from global stock market returns no matter where they come from.
Exhibit 3
Global REITs (Real Estate Investment Trusts)
- Global REITs, as represented by the Dow Jones Global Select REIT, rose by 2.0% over the quarter and were up by 8.1% over the last 12 months.
- In the US, REITs rose by 4.6% during the quarter and are up by 7.2% during the last 12 months.
Global Fixed Income
- U.S. taxable bond returns were mostly negative during Q1 but still up during the last 12-months with longer maturities suffering as rates rose while short-term TIPS fared best during the quarter rising 0.9%.
- International bonds ex-US (hedged USD) were also negative over the trailing quarter (-0.2%) but positive for the last 12-months (2.8%).
- Short-term municipal bonds were positive for the quarter (0.4%) and one-year trailing time periods (3.5%) while intermediate-term munis were down for the quarter (-0.6%) but up 4.5% for the last 12 months.
Why did Treasury prices decline in March?
Many investors look back on the final month of the first quarter and ask themselves why bond prices declined when stock prices did too. It’s a fair question because conventional wisdom tends to suggest that when stock markets are going through a down period, investors seek safety in bonds—especially U.S. Treasuries, which are still widely regarded as one of the world’s primary safe-haven assets. But that didn’t happen this time. Ultimately, the expectation that bonds will always increase in value when stocks decline assumes that stock market performance and volatility are the only things that affect bond prices and performance. While this relationship makes some rational sense, it is not a complete understanding of how bonds are priced. The major determinant of a bond’s price is the prevailing market interest rate. As rates rise, prior issued bonds lose value because their stated interest payments at issuance now look somewhat less attractive compared to newer bonds being issued with higher interest payments. The opposite is also true where bonds increase in value when prevailing market interest rates decline.
So, for investors looking to answer the question of why bonds declined last month at the same time stocks declined, we need to look at what was influencing interest rates at the time and not necessarily at how stock markets performed. One potential reason for the increase in interest rates is because of the war in Iran’s upward effect on oil and gas prices, which can feed into increased inflation expectations causing rates to rise. If a market shock is viewed as potentially inflationary, investors will demand added return for this potential inflation uncertainty, which results in lower stock and bond prices today. To the contrary, if a market shock is viewed as deflationary, such as early COVID and the Great Financial Crisis periods, investors will likely anticipate slowed economic growth and even potential recession. This tends to pull inflation, growth assumptions, and stock prices downward along with interest rates, which in turn boosts bond prices. Other potential causes for last month’s rising interest rates for U.S. Treasuries are continued concerns about U.S. government fiscal spending, overall debt levels, and investors looking to buy more non-USD denominated assets. This dynamic shows that many variables are taken into account when determining a bond’s price and that bond markets do not always increase in value when stocks decline.
Overall, we continue to view our bond allocations as a method of reducing overall portfolio risk (as measured by standard deviation), given that stocks are expected to have much higher volatility. Our portfolio’s focus will continue to be on high quality bonds with an emphasis on short to intermediate duration government and corporate bonds, where default risk has historically been relatively low.
East Bay Investment Solutions, a Registered Investment Advisory firm, supplies investment research services under contract.
Investment advisory services offered through Equita Financial Network, Inc. (“Equita”). Equita also markets investment advisory services under the name AegleWealth LLC. East Bay Investment Solutions and Equita Financial Network, Inc. have an arrangement whereby East Bay Investment Solutions, a Registered Investment Advisory firm, provides model recommendations on a consulting basis to Equita Financial Network, Inc. Equita Financial Network, Inc. maintains full discretion and trading authority over its clients’ accounts.
East Bay Investment Solutions and AegleWealth LLC are independent from and unaffiliated with each other; however, AegleWealth LLC has engaged East Bay Investment Solutions to provide nondiscretionary investment portfolio recommendations. AegleWealth LLC, to the exclusion of East Bay Investment Solutions, retains the discretionary authority to accept or reject East Bay Investment Solutions’ investment portfolio recommendations with respect to its clients’ accounts.
This material contains general information, may be based on authorities that are subject to change, and is not a substitute for professional advice or services. This material does not constitute tax, consulting, business, financial, investment, legal or other professional advice, and you should consult a qualified professional advisor before taking any action based on the information herein. This material is confidential and intended for the exclusive use of clients or prospective clients of AegleWealth LLC. Information has been obtained from a variety of sources believed to be reliable though not independently verified. To the extent capital markets assumptions or projections are used, actual returns, volatilities and correlations will differ from assumptions. Historical and forecasted information does not include advisory fees, transaction fees, custody fees, taxes or any other expenses associated with investable products. Actual fees and expenses will detract from performance. Past performance does not indicate future performance.
The sole purpose of this material is to inform, and it is not intended to be an offer or solicitation to purchase or sell any security or other investment product. Investments mentioned in this material may not be suitable for all investors. Before making any investment, each investor should carefully consider the risks associated with the investment and make a determination based on the investor’s own particular circumstances, and carefully consider whether the investment is consistent with the investor’s investment objectives.
Certain information in this material was originally prepared by East Bay Investment Solutions and subsequently modified or altered by AegleWealth LLC. East Bay Investment Solutions has not reviewed, approved, or endorsed any subsequent modifications by AegleWealth LLC. Although information in this material has been obtained from sources believed to be reliable, East Bay Investment Solutions does not guarantee its accuracy, completeness or reliability and are not responsible or liable for any direct, indirect or consequential losses from its use. Any such information may be incomplete or condensed and is subject to change without notice.
Investment Advisory services offered through Equita Financial Network, Inc., an Investment Adviser with the U.S. Securities and Exchange Commission. Equita Financial Network also markets investment advisory services under the name AegleWealth. The foregoing content reflects our opinions and is subject to change at any time without notice. Content provided herein is for informational purposes only and should not be used or construed as investment advice or a recommendation regarding the purchase or sale of any security. There is no guarantee that the statements, opinions, or forecasts provided herein will prove to be correct. All investing involves risk, including the potential for loss of principal. There is no guarantee that any investment plan or strategy will be successful. Along with the author’s views, the reflections above include contributions from Beyond AUM and ChatON AI.